In January 2020 I posted a series of tweets about an announced plan by British farmers to reduce net greenhouse gas emissions to zero by 2040 and also looked at how easy this might be for Canadian agriculture. For the convenience of web searchers looking for this type of information and at a future date, I have reproduced them below – along with some comments added as a result of related Twitter discussion.
I’m impressed with an initiative announced in 2019 by @NFUtweets to achieve zero net GHG emissions for British agriculture by 2040. https://nfuonline.com/nfu-online/business/regulation/achieving-net-zero-farmings-2040-goal/…. This thread includes some analysis from a Canadian perspective, and an examination of corresponding Canadian data.
The NFU report is based on 2017 UK stats showing total national agricultural GHG emissions of 45.6 Mt CO2 equivalent – or about 10% of the UK total. The agricultural number includes CO2, CH4 and N20 losses from fertilizer usage, livestock, manure and on-farm fuel use, though not from changes in agricultural soil org matter content.
If you include UK agricultural soil CO2 emissions – positive for cropland, negative for grassland – and allow for off-farm agricultural transport, the UK total is slightly larger at 49.8 Mt – perhaps 11% of UK total GHG emissions. The UK data are here, https://theccc.org.uk/publication/net-zero-technical-report/…. See also, https://royalsociety.org/-/media/policy/projects/greenhouse-gas-removal/royal-society-greenhouse-gas-removal-report-2018.pdf…
The NFU plan involves about 9 Mt CO2 equivalent (or 20%) removed by on-farm carbon sequestration and up to 22 MT (~50%) as bioenergy from agriculture with the CO2 emission from bioenergy combustion captured and stored underground. The report also mentions potential longer-term use of biochar.
The NFU’s projected on-farm sequestration may be a stretch given pressures to convert from livestock (perennial forages) to arable agriculture. Also, CO2 capture and storage is a largely-still-to-be-developed technology as of year 2020.
But as the analyses to follow indicate, the Canadian agricultural challenge may be even larger. Canadian GHG emission stats for 2017 (the latest available) are in three on-line volumes, all available at: http://publications.gc.ca/site/eng/9.506002/publication.html… .
Here are links to the Executive Summary and Part 1 containing the main data. (Parts 2 and 3 have more details about calculations.) https://canada.ca/en/environment-climate-change/services/climate-change/greenhouse-gas-emissions/sources-sinks-executive-summary-2019.html… http://publications.gc.ca/collections/collection_2019/eccc/En81-4-2017-1-eng.pdf… .
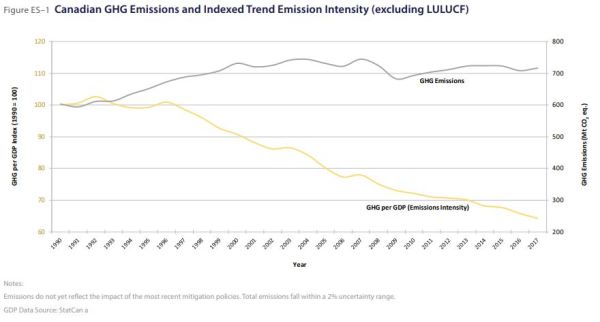
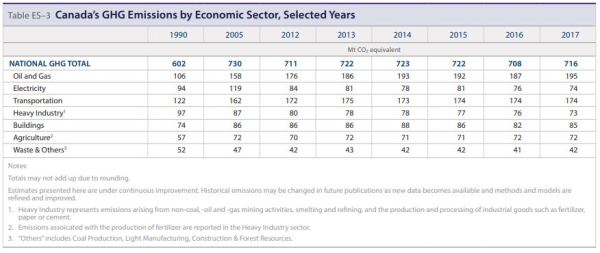
GHG emissions for Canada totalled 716 Mt CO2 equivalent in 2017, marginally less than the 730 Mt in 2005 but well up from the 602 Mt in 1990. These numbers don’t include CO2 sequestration by agricultural soils and forestry (more on this later).
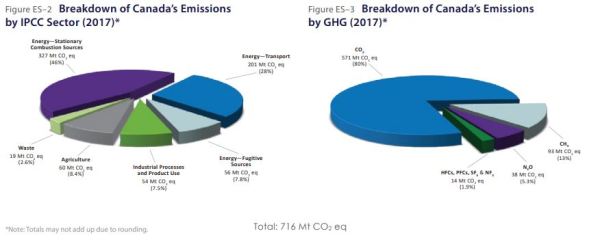
Agricultural emissions are about 8.4% of Canadian total according to these graphs.
But these data don’t include on-farm fuel usage. If you include that, the agricultural total comes to 72 Mt CO2 equivalent, or about 10% of Canadian total. This total is little changed from 2005 but up from 1990.
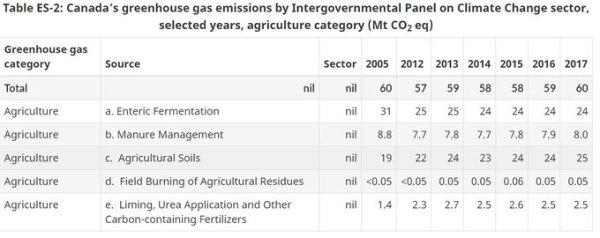
Within agriculture, GHG data since 2005 have shown a decrease in GHG emissions from ruminants and manure, but an offsetting increase in N2O emissions from soil linked to more N fertilizer usage.
This table shows agricultural soil sequestration in Kt/year CO2 equivalent attributable to less summer fallow, more no-tillage, and shifts between annual and perennial crops. (Histosols means organic soils.) Calculations assume that the per-ha/per-year no-till benefit decreases annually from date of implementation.

This table, prepared using the Canadian data, shows sums of agricultural emissions minus agricultural soil sequestration of carbon. One weakness in the input data is the lack of recognition of the increased soil sequestration with higher yields (eg., with increased fertilization).

One major conclusion: Canadian agriculture faces a huge challenge if it’s to cut net GHG emissions by 30% below 2005 levels by 2030, as per the Canadian Paris Accord commitment – let alone 100% by 2040 or 2050 (See, https://canada.ca/en/environment-climate-change/services/environmental-indicators/progress-towards-canada-greenhouse-gas-emissions-reduction-target.html…).
Here are some additional comments not in the original Twitter thread:
There is debate about the inclusion of a credit for all of the carbon in organic matter fixed photosynthetically by crop plants. If the fixed carbon is converted to CO2 quite quickly, say within a year or less – as in crop residue left on the surface and not converted to longer-term soil organic matter – or harvested as grain, seed and/or forage and consumed soon after as livestock or human food – this is not included in the calculations as it is assumed to represent neither a longer-term source nor sink.
But what about the carbon in crop products/commodities exported to other countries? The IPCC calculations give no C credit to the exporting country or debit to importer, but maybe they should. Where exports are involved, the IPCC generally assigns GHG emissions associated with manufacturing/production to the country where that occurs, rather than the country where consumption occurs. However, one exception occurs with petroleum and its energy products where GHG emissions are credited to the country of consumption. That’s why, for example, Canada gets assigned the GHG emissions associated with oil extraction, processing and shipment – but not combustion if/when that occurs in another country.
Another anomaly occurs with biofuels. From one perspective, the grain and oilseeds used to make fuel ethanol and biodiesel are no different that that used to produce food and feed. The CO2 fixed during the growing season is mostly returned to CO2 within a year. But, ethanol and biodiesel used as fuel result in important reductions in net GHG emissions associated with transportation fuel – i.e., by comparison with the hydrocarbons they replace. That credit goes to the transportation fuel manufacturers under IPCC accounting. Should it go to agriculture – as what the UK NFU proposes to address about 50% of their strategy for meeting a zero-emission goal by 2040? It depends on perspective.
One final comment: While discussion such as that in the preceding three paragraphs stimulates active discussion within agricultural circles, ultimate judgments on credits for cuts in net GHG emissions for agriculture will depend on calculation procedures dictated by IPCC. Here’s an index to IPCC calculation protocols. My impression is that it is extremely difficult to effect changes especially if driven by one country and/or one industry. That’s a hurdle that farm groups in many countries will face as they attempt to develop and get credit for strategies to reduce net GHG emission through innovative uses of agricultural products.
A special thanks to farmer Fraser McPhee at Dauphin Manitoba for his commitment to a better understanding of GHG emissions in Canadian agriculture – and for the useful discussion which triggered some of my discussion above. While Fraser and I don’t necessarily agree on everything, I do appreciate his dedicated efforts.
