Summary in one sentence:
In 2023 on our farm near Guelph, a program involving variable rates of N application on corn, with the second split applied on July 12, with mean rate depending on rainfall accumulation from corn stages V5 to V12, and with reduced rates of N application where soil organic matter levels were higher, produced satisfactory yield results.
———
As described in a recent column, I think we do an inadequate job in Ontario of predicting nitrogen fertilizer rates for corn.
About 3 years ago, I decided to try to do better. I started by having Woodrill, a farm and farm service business near Guelph, provide detailed soil maps of our two farms. More details on the Woodrill service is here.
Our plan is to split the nitrogen fertilization, with the second (side-dress) application rate in July reflecting both rainfall accumulation to date (hence, expected crop yield) and differences in soil organic matter.
A caution that this is not leading edge. Many farmers have done something comparable before. I am providing a brief description of what we did and what we learned in the expectation that it might be useful to others.
For adjusting the N rate for rainfall, I used this graph produced by Caleb Niemeyer of Woodrill and the University of Guelph as part of his MSc thesis. The underlying research was done at the Elora Research Station on a soil and location similar to our own. (Caleb is now pursuing a doctorate degree at UofG while also employed by Woodrill. He and Dan Breckon of Woodrill have been of major help to me in this venture.)
The graph shows the extra N to be applied – in addition to the amount recommended by the Ontario Ministry of Agriculture, Food and Rural Affairs (OMAFRA) – depending on rainfall accumulation between corn development stages V5 and V12 (roughly mid-June to mid-July).

Rate of N application was also adjusted depending on variations in soil organic matter. Soil organic matter was defined as product of percent organic matter in surface soil multiplied by top soil (A-horizon) depth. The greater the SOM, the less N applied, with the rate adjustment based largely on the work of Greg Stewart (formerly of the University of Guelph, then OMAFRA, then Maizex Seeds, and now Syngenta) as quantified in the Maizex Nitrogen Tracker available here. Rate of side-dress N application was also adjusted to include the amount of nitrogen in the variable amounts of MAP (mono-ammonium phosphate) applied before corn planting. (Variation in both soil P and K measurements on this farm was high.)
All fertilizer was applied by Sharpe Farm Supplies, near Guelph. Special thanks goes to Michael Sharpe for his interest and his tolerance of my whims.
The 2022 growing season was mainly about mastering technology. The summer season was the driest for us in many years, and the proper N side-dress rate was likely zero. However, we applied the urea too early, on July 2, to enable us to foresee the need to adjust the N rate as low as it could have been. The corn was also too short on this date and the boom did not bend plants over as it passed. If it had done so, the amount of burning caused by urea pellets falling into whorls would have been less, according to Michael’s experience.
Recent research by Brady and Nasielski at UGuelph shows that the yield loss caused by such burning is less than expected from visual appearances, especially with urea application – but it’s still something to minimize.
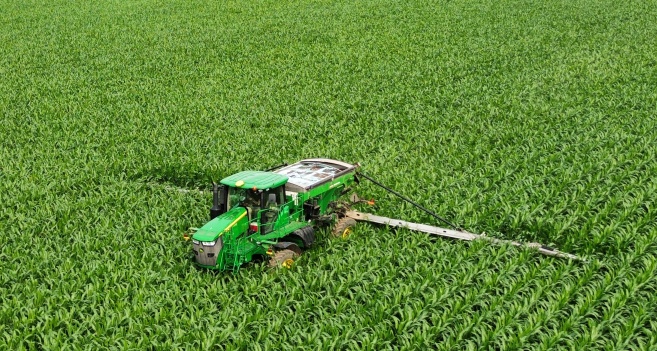
In 2023, we did it much better. About 90 lb/acre of N as urea plus the N in MAP was applied in two passes, before a light pre-planting cultivation of the soybean crop residue. Side-dress urea was applied on July 12. All urea applied in this project, both pre-planting and at side-dressing, was treated with urease and nitrification inhibitors to minimize losses and nitrous oxide formation. The average rate of N applied, pre-plant plus side-dress, based on projected rainfall from V5 to V12 and the Niemeyer equation, was about 166 lb/acre. July 12 occurred a day or two before stage V12.
However, it then rained an additional 40 mm during the first 24 hours after side-dress N application. If we had calculated N rate including that rainfall, the average application rate would have been about 185 to 190 pounds/acre.
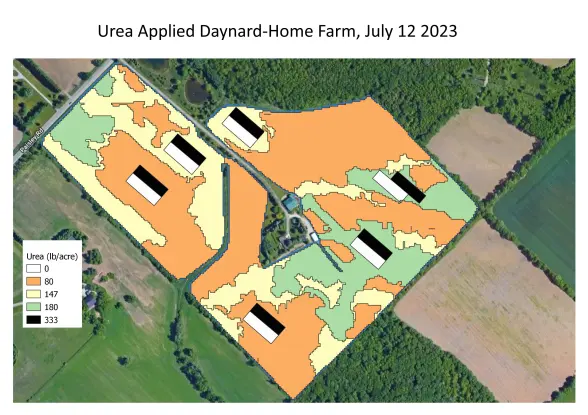
In addition to variable rates of urea application, the farm also included some paired plots with either 0 or 150 lb/acre of N side-dress application. A map of the farm indicating side-dress urea rates (though not total N applied) is shown below. Urea is 45% N.

Grandridge Farms planted and harvested the corn crop. A special thank you goes to Dan Martin of Grandridge for providing the combine yield data, and to Cory Weber of FS Partners/Growmark for helping with the analyses and for his valuable advice.
Combine field data collected from within the 0 and 150 lb/acre plots were used to calculate MERNs (Most Economical Rate of Nitrogen) using an algorithm recommended by Ken Janovicek et al, 2021 (see here and here).
The Janovicek equation is not calibrated for use with the high rates of pre-plant N applied in this project. But the equation did produce MERN values that seemed very reasonable – an average of about 185 lb/acre of N – or about the same as the Niemeyer equation would have predicted if we’d included the additional 40 mm of rainfall. These MERN rates were calculated using a N-to-corn price ratio (lb of N/lb of corn) of 7.5. With a higher ratio, the MERN values would also have been somewhat lower – and vice versa.
Note that I also checked the yields, using combine yield maps, for two adjacent sites near each of the 0-vs-150 pairs that had received N fertilizer based on rainfall, MAP application and soil organic matter for that zone. These yields were about 7 to 10 bushels/acre lower than those achieved applying an additional 150 lb/acre of N. The farm average yield was 192 bushels/acre.
I will not describe the specifics of data analyses other than to note that they involved use of QGIS, Excel and other software programs – and were decidedly too complex for my liking. A special thanks to Dr. John Sulik, Department of Plant Agriculture, UGuelph, as well as to Caleb Niemeyer, for their continuing guidance and patience as I learned how to perform these steps.
A key step involved ‘cleaning’ the combine yield data before further analyses. Three general procedures were used: One was developed by Dr. Tuomas Mattila and his colleagues at the Finnish Environment Institute (details here). One done by Cory Weber using EFP Fieldalytics software is available through the Growmark Cooperative, and one involved use of the USDA Field Editor2.0 with critical help provided by Danny Jefferies of OMAFRA.
The analyses using the three procedures produced similar results: There was a small (but statistically significant at P<0.01) trend for yield to increase as soil organic matter level increased – even though the rate of N applied was 30 lb/acre lower for the highest level of SOM versus the lowest. The yield difference from low to high SOM ranged from 4 to 10 bushels/acre, depending on calculation specifics.
The MERNs, near 185 lb/acre, were all well above the ~115 lb/acre recommended using OMAFRA algorithms.
So what did we learn?
- The rate adjustment for rainfall recommended by the Niemeyer equation was about right,
- The results did not indicate the desirability of a reduced N rate in a good growing season like 2023,
- There seems to be opportunity to apply less N where the soil organic matter level is higher.
- The OMAFRA base rate recommendation was too low in 2023.
- Simpler software procedures are needed for doing calculations of MERN and zonal crop yields.
I consider ourselves lucky that the results turned out as clear as they did in 2023. However, the 2023 results do provide good reason to do the same in 2024.
One big difference in 2024: we’ll be fertilizing our corn crop based on calculations using farm-specific data – rather than educated guesses of previous years.
I also hope we can include more 0-versus-150 comparisons in 2024. They are very easy to do in the field and the results can be so meaningful.
An apology to international readers on my use of pounds, bushels and acres. One pound (lb) per acre = 1.12 kg/ha. The farm average yield of 192 bushels/acre equates to about 12.1 tonnes/ha.
Also, while I used mapping service provided by Woodrill, I think a similar approach could be used with soil maps provided in Ontario by SoilOptix or SWATMaps.
Thanks to Wellington County and the Grand River Conservation Authority, and to Agriculture and Agri-Food Canada, the Ontario Soil and Crop Improvement Association and their On-Farm Climate Action Fund, for their financial support of this project.