Our Farm’s Experience with Variable-Rate N Fertilization of Corn

dji_fly_20230712_173526_86_1689278382594_photo_optimized

Summary in one sentence:

In 2023 on our farm near Guelph, a program involving variable rates of N application on corn, with the second split applied on July 12, with mean rate depending on rainfall accumulation from corn stages V5 to V12, and with reduced rates of N application where soil organic matter levels were higher, produced satisfactory yield results.

———

As described in a recent column, I think we do an inadequate job in Ontario of predicting nitrogen fertilizer rates for corn.

About 3 years ago, I decided to try to do better. I started by having Woodrill, a farm and farm service business near Guelph, provide detailed soil maps of our two farms. More details on the Woodrill service is here.

Our plan is to split the nitrogen fertilization, with the second (side-dress) application rate in July reflecting both rainfall accumulation to date (hence, expected crop yield) and differences in soil organic matter.

A caution that this is not leading edge. Many farmers have done something comparable before. I am providing a brief description of what we did and what we learned in the expectation that it might be useful to others.

For adjusting the N rate for rainfall, I used this graph produced by Caleb Niemeyer of Woodrill and the University of Guelph as part of his MSc thesis. The underlying research was done at the Elora Research Station on a soil and location similar to our own. (Caleb is now pursuing a doctorate degree at UofG while also employed by Woodrill. He and Dan Breckon of Woodrill have been of major help to me in this venture.)

The graph shows the extra N to be applied – in addition to the amount recommended by the Ontario Ministry of Agriculture, Food and Rural Affairs (OMAFRA) – depending on rainfall accumulation between corn development stages V5 and V12 (roughly mid-June to mid-July).

2023-03-22 10_28_11-UG ETD Template

Rate of N application was also adjusted depending on variations in soil organic matter.  Soil organic matter was defined as product of percent organic matter in surface soil multiplied by top soil (A-horizon) depth. The greater the SOM, the less N applied, with the rate adjustment based largely on the work of Greg Stewart (formerly of the University of Guelph, then OMAFRA, then Maizex Seeds, and now Syngenta) as quantified in the Maizex Nitrogen Tracker available here. Rate of side-dress N application was also adjusted to include the amount of nitrogen in the variable amounts of MAP (mono-ammonium phosphate) applied before corn planting. (Variation in both soil P and K measurements on this farm was high.)

All fertilizer was applied by Sharpe Farm Supplies, near Guelph. Special thanks goes to Michael Sharpe for his interest and his tolerance of my whims.

The 2022 growing season was mainly about mastering technology. The summer season was the driest for us in many years, and the proper N side-dress rate was likely zero. However, we applied the urea too early, on July 2, to enable us to foresee the need to adjust the N rate as low as it could have been. The corn was also too short on this date and the boom did not bend plants over as it passed. If it had done so, the amount of burning caused by urea pellets falling into whorls would have been less, according to Michael’s experience.

Recent research by Brady and Nasielski at UGuelph shows that the yield loss caused by such burning is less than expected from visual appearances, especially with urea application – but it’s still something to minimize.

In 2023, we did it much better. About 90 lb/acre of N as urea plus the N in MAP was applied in two passes, before a light pre-planting cultivation of the soybean crop residue. Side-dress urea was applied on July 12. All urea applied in this project, both pre-planting and at side-dressing, was treated with urease and nitrification inhibitors to minimize losses and nitrous oxide formation. The average rate of N applied, pre-plant plus side-dress, based on projected rainfall from V5 to V12 and the Niemeyer equation, was about 166 lb/acre. July 12 occurred a day or two before stage V12.

However, it then rained an additional 40 mm during the first 24 hours after side-dress N application. If we had calculated N rate including that rainfall, the average application rate would have been about 185 to 190 pounds/acre.

In addition to variable rates of urea application, the farm also included some paired plots with either 0 or 150 lb/acre of N side-dress application. A map of the farm indicating side-dress urea rates (though not total N applied) is shown below. Urea is 45% N.

Rates of Urea Application, Daynard-Home, July 12 2024

Grandridge Farms planted and harvested the corn crop. A special thank you goes to Dan Martin of Grandridge for providing the combine yield data, and to Cory Weber of FS Partners/Growmark for helping with the analyses and for his valuable advice.

Combine field data collected from within the 0 and 150 lb/acre plots were used to calculate MERNs (Most Economical Rate of Nitrogen) using an algorithm recommended by Ken Janovicek et al, 2021 (see here and here).

The Janovicek equation is not calibrated for use with the high rates of pre-plant N applied in this project. But the equation did produce MERN values that seemed very reasonable – an average of about 185 lb/acre of N – or about the same as the Niemeyer equation would have predicted if we’d included the additional 40 mm of rainfall. These MERN rates were calculated using a N-to-corn price ratio (lb of N/lb of corn) of 7.5. With a higher ratio, the MERN values would also have been somewhat lower – and vice versa.

Note that I also checked the yields, using combine yield maps, for two adjacent sites near each of the 0-vs-150 pairs that had received N fertilizer based on rainfall, MAP application and soil organic matter for that zone. These yields were about 7 to 10 bushels/acre lower than those achieved applying an additional 150 lb/acre of N. The farm average yield was 192 bushels/acre.

I will not describe the specifics of data analyses other than to note that they involved use of QGIS, Excel and other software programs – and were decidedly too complex for my liking. A special thanks to Dr. John Sulik, Department of Plant Agriculture, UGuelph, as well as to Caleb Niemeyer, for their continuing guidance and patience as I learned how to perform these steps.

A key step involved ‘cleaning’ the combine yield data before further analyses. Three general procedures were used: One was developed by Dr. Tuomas Mattila and his colleagues at the Finnish Environment Institute (details here). One done by Cory Weber using EFP Fieldalytics software is available through the Growmark Cooperative, and one involved use of the USDA Field Editor2.0 with critical help provided by Danny Jefferies of OMAFRA.

The analyses using the three procedures produced similar results: There was a small (but statistically significant at P<0.01) trend for yield to increase as soil organic matter level increased – even though the rate of N applied was 30 lb/acre lower for the highest level of SOM versus the lowest. The yield difference from low to high SOM ranged from 4 to 10 bushels/acre, depending on calculation specifics.

The MERNs, near 185 lb/acre, were all well above the ~115 lb/acre recommended using OMAFRA algorithms.

So what did we learn?

  • The rate adjustment for rainfall recommended by the Niemeyer equation was about right,
  • The results did not indicate the desirability of a reduced N rate in a good growing season like 2023,
  • There seems to be opportunity to apply less N where the soil organic matter level is higher.
  • The OMAFRA base rate recommendation was too low in 2023.
  • Simpler software procedures are needed for doing calculations of MERN and zonal crop yields.

I consider ourselves lucky that the results turned out as clear as they did in 2023. However, the 2023 results do provide good reason to do the same in 2024.

One big difference in 2024: we’ll be fertilizing our corn crop based on calculations using farm-specific data – rather than educated guesses of previous years.

I also hope we can include more 0-versus-150 comparisons in 2024. They are very easy to do in the field and the results can be so meaningful.

An apology to international readers on my use of pounds, bushels and acres. One pound (lb) per acre = 1.12 kg/ha. The farm average yield of 192 bushels/acre equates to about 12.1 tonnes/ha.

Also, while I used mapping service provided by Woodrill, I think a similar approach could be used with soil maps provided in Ontario by SoilOptix or SWATMaps.

Thanks to Wellington County and the Grand River Conservation Authority, and to Agriculture and Agri-Food Canada, the Ontario Soil and Crop Improvement Association and their On-Farm Climate Action Fund, for their financial support of this project.

Serious flaws in new Ontario Report on Climate Change and Ontario Agriculture and Food

2023-10-26 10_43_15-Window

In 2020, the Ontario Ministry of Environment commissioned a study by the Climate Risk Institute, called the Provincial Climate Change Impact Assessment (PCCIA), to predict effects of climate change on several aspects of the Ontario economy, including agriculture and food, for the remainder of this century. The resulting report was submitted to government in January 2023 and made public in August.

The 505-page report, plus appendices, represents lots of work and contains valuable information. However, in my view, its key conclusions about expected climatic effects on Ontario agriculture and food are seriously flawed. The following commentary explains why.

The report concludes, with respect to agriculture and food, “any potential opportunities [from warming climate] are likely to be offset by negative impacts, resulting in declining productivity, crop failure, and livestock fatalities. Several commodities, particularly in the southern regions of the province, are expected to face ‘very high’ climate risks by the end of the century.”

And also, “The assessment results indicate that field crop risk profiles across all regions of the province will be ‘high’ or ‘very high’ by the end of century.”

I have reviewed sections of the report relevant to agriculture and food (including sections on project methodology, overall climate projections and several appendices), and believe that there are three reasons for treating its conclusions with deep caution – indeed skepticism.

First, the report’s analyses depend very heavily on the extensive Assessment Reports (AR) produced every 5-10 years by the International Panel on Climate Change (IPCC) – and specifically the AR5 reports produced in 2013-2014.

However, in April 2021 Working Group 1 (WG I) of the IPCC released the AR6 version of its important Physical Basis of Climate Change, which contains essentially all of the global IPCC information pertinent to the PCCIA study. The WG I report was followed by release of corresponding reports by WG II and WG III, the last release in early 2022.

Although the IPCC AR6 reports were available many months before the PCCIA was completed (16 months in the case of WG I), the changes IPCC made were mostly unused in the PCCIA analyses. PCCIA authors defend this decision by stating that AR6 does not negate their conclusions based on AR5. Yet, many of the changes in AR6 are substantive – both in data provided as well as in the detailed analyses. (See here.)

Given the length of time between release of the AR6 reports, and the release of the PCCIA in January 2023, I believe that team should have made more effort to base their analyses on current IPCC data and perspectives.

The second weakness is much larger. The IPCC uses groups of climate models to envision what climate might be like in remaining years of this century.  Details are complex but, in general, the models differ based on amount of global heating to be caused by humans. There are models that involve assumptions of very low and low heating (average of ~2 Watts/m2), medium heating (~4.5 W/m2), high (~7 W/m2) and very high (8.5 W/m2).

When AR5 was written, the 8.5 W/m2 heating option was considered very high but still quite plausible. However, as scientific knowledge advanced and AR6 reports were being written, the likelihood of 8.5 W/m2 came to be considered much less plausible. For a detailed, informed discussion on this, see here. Of particular note, in background documents that the UNFCCC (United Nations Framework Convention on Climate Change – the parent of IPCC) published in 2021 and 2022 for use at international climate conventions on climate change, the 8.5 W/m2 scenario does not appear to be even mentioned. By contrast, these documents show that 4.5 W/m2 model calculations match quite well global temperature expectations, including corrective measures now being implemented by governments and industry worldwide.

In producing the PCCIA, the Climate Risk Institute completed extensive analyses using both the 4.5 W/m2 – that it labels as a “low (or sometimes “lower”) emission pathway” – and the 8.5 W/m2 option that it labels “high emission pathway.” The PCCIA also refers the 8.5 W/m2 option as “business as usual” (Appendix 4) – which as numerous informed authorities have pointed out, it definitely is not.

More critically, despite completing comparable, parallel analyses for both the 4.5 and 8.5 analyses, the PCCIA document reports mainly – and in many cases only – the 8.5 W/m2 results. I don’t understand why.

If the writers’ objective was to present a worst-case perspective, that might make sense. But to portray it as probable – indeed, “business as usual” – while mostly marginalizing model 4.5 W/m2 results is in my view selective and misleading. For a much more detailed commentary/analysis on this by a credible climate scientist, see here – a commentary that was published, by the way, in 2020, likely before the PCCIA study was started.

My third point involves the reasonableness of the report’s conclusions about late-century climatic effects on Ontario agriculture. The report states that the 8.5 W/m2 climate change models predict no notable increases in drought stress in Ontario; expected increases in precipitation match increases in evaporative demand. The PCCIA 8.5 analyses do predict an increase in the number of very intense one-day (but not three-day) localized rainfall events. However, the major predicted effect is an increase in the number of summer days with maximum temperatures of above 30C – which the report labels as ‘extreme heat.’ Because of this, it projects major future reductions in the productivity of many Ontario crops including corn, soybeans and winter wheat.

IPCC AR6 WG I models estimate an average 4.4C increase in average global temperature by the year 2100 with 8.5 W/m2 increase in global heating. By coincidence, that corresponds almost exactly to the difference in average July daily maximum temperature between Woodstock, Ontario and St. Louis, Missouri.

But present-day farmers in Southern Illinois (across the Mississippi River from St. Louis) have no trouble producing good corn, soybean and wheat yields with their high number of above 30C maximum temperatures! In fact, the average daily maximum in July in St. Louis is 31.6C, meaning the majority of days in July now exceed 30C. The Mississippi Delta, where soybeans are grown extensively and successfully, is hotter still.

So, bottom line:

There is an abundance of information showing that high net GHG emissions are likely to cause problems for humans globally. Ontario and other Canadian farmers should do their part to reduce net GHG emissions where this can be done without seriously affecting food output and farm family income. However, I’d recommend not using results of the 2023 Provincial Climate Change Impact Assessment provide realistic projections on what the climate holds in store for Ontario farm production in the remainder of the twenty-first century.

The Weakest of the Four Rs: Nitrogen Application Rates for Corn

20210503_133643

Farm nitrogen (N) fertilization practices are receiving major attention across Canada, stimulated by the combination of very high prices for N materials and concerns over fertilizer-linked nitrous oxide (N2O) emissions – N2O being a powerful greenhouse gas.

The 4R approach promoted by the North American fertilizer industry (reference here) – Right Material, Right Timing, Right Placement and Right Rate – has been featured in many discussions, and rightly so. It’s a good approach.

Of the four Rs, we have good guidance from research on three. The use of urease and nitrification inhibitors and polymer-coated urea means better N-use efficiency in many cases and less N2O. Soil incorporation is usually better than non-incorporation. And split applications, with some N applied near planting time followed by more 4 to 10 weeks later for corn is usually better than all applied at planting.

But on rates of N application for corn, especially in Ontario, there is a lot of uncertainty – too much, in my view.

(A quick note: With apologies to international readers, the following is presented almost entirely using pounds, bushels and acres – for the reason that these remain the main units of fertilizer usage in Canadian farming. My target audience for this column is farmers; soil specialists can find much more detailed information elsewhere.)

The Ontario Ministry of Agriculture, Food and Rural Affairs (OMAFRA) has provided an on-line N calculator for corn for many years. There are, in fact, two versions on the web as of early 2023 – the first version here and a newer one here. The two are similar but not the same. The first version considers the comparative prices of nitrogen fertilizer and grain corn in making the recommendation, and calculates significantly lower rates when the N is applied at time of side-dress application versus planting. The newer version ignores prices and does not distinguish between at-planting versus side-dressing. However, it does make N recommendations on a township-by-township basis. Recommended N application rates rise as yield expectation increases with both versions.

Calculations using version one for our farm near Guelph for loam soil, corn after soybeans, average yield of 190 bushels/acre and a price ratio of 8:1 (price per unit of weight for urea versus corn), give recommendations of 128 pounds of N/acre (144 kg/ha) pre-plant applied, and only 102 pounds/acre if the N is all side-dressed in June. Calculator version two gives a recommendation of 116 pounds/acre.

I don’t think our farm situation is unique. Most Ontario farmers would likely consider these rates too low.

At a couple of winter 2023 farm meetings, a respected industry agronomist asked two audiences of at least 200 farmers how many were using the OMAFRA calculator recommendations. About a dozen hands went up each time.

It would be easy to conclude, therefore, that the OMAFRA calculators underestimate N application needs for most farms – “need” being defined as the most economical (profitable) rate while taking into account judgements about the large and largely unpredictable uncertainty that exists in seasonal crop needs.

However, those OMAFRA rates – at least for version one – were calculated by Ken Janovicek (research analyst, University of Guelph) and Greg Stewart (then OMAFRA corn specialist), both known for their thoroughness, based on a detailed analysis of hundreds of N-response research trials across Southern Ontario.

The field trials were mostly pre-2000 and it has been suggested that newer corn hybrids are more responsive to higher N rates than what the calculator recommends. However, there are few research data to support this conjecture. In fact, there is good evidence that newer hybrids are more efficient in their use of fertilizer N. See, for example, this study by Ciampitti and Vyn .

A check with US states to the west/south-west of Ontario shows that seven of them, from Michigan to Iowa, use a common approach to corn nitrogen calculations (see here). A review of their recommended rates shows that these are also mostly lower than what many/most Ontario corn growers use. The recommended rates for the seven states do vary according to N/corn price ratios but, surprisingly, are independent of projected yield.

For those interested, an excellent discussion about the rationale behind the Midwest recommendations is available here. (A more comprehensive discussion is available here.)

It would be easy to conclude, based on the above, that the difference between public recommendations and farmer application rates is attributable to farmers applying more than economically needed/justified.

But there is good evidence the other way too. In a well-run, 10-year experiment at the Elora Research Station, Dr. Bill Deen, Dr. Joshua Nasielski, Caleb Niemeyer and colleagues found that the economically optimum N rate was always higher than that recommended by the OMAFRA calculator – often by a substantial amount, and with the gap being greater as amount of pre-silking rainfall increased. The same has been seen in other long-term corn-N-response research experiments at Elora and Ridgetown ON. (There is more discussion on this research below.)

A closer look at the Midwest recommendations also shows some important variances. Here is a graph showing the range in most economical N application rates for Michigan using current new-crop prices for corn and urea, and corn after soybeans.

2023-03-22 10_23_19-Calculator __ Nitrogen Rate Calculator

The average recommended rate is 139 lb/acre of N, but this ranges from about 50 to near 250 lb/acre.

So what’s going on here?

Perhaps it is best to start by taking a look at the total amount of N required to produce a corn crop – almost always substantially higher than the amount recommended for application. I have seen estimates from 200 to 275 pounds/acre of N in the grain, stover and roots of a 200-bushel/acre (12.6 t/ha) corn crop, with the discrepancies generally reflecting differences in measured or assumed protein/N content in all three components.

Let’s say this is 240 pounds/acre on average. Nitrogen will be contained in root exudates as well though there is a good chance that this N becomes available again for seasonal crop uptake after digestion by root-associated micro-organisms.

Also, the crop cannot use the available N with 100% efficiency. If the efficiency is only 2/3, then the total amount of potentially available N needed becomes 360 pounds/per acre. Since nearly all of the N supply comes from fertilizer application and the breakdown (mineralization) of soil organic matter plus previous crop residues, that means that the latter is at least as important as the former.

Of course, a substantial portion (perhaps 1/3 or more) of the total N contained in grain corn plus crop residue (‘stover’) and roots is returned to the soil after harvest. That reduces the net amount of N used in growing the crop. However, all of that N is needed to grow the crop, even if a substantial amount is credited back to soil afterwards.

Note that this is not simply a case of crediting the N in non-harvested parts of the crop in year one as input for year two. For if that was the case, we’d need less N fertilizer for corn when grown after corn than after soybeans – the latter producing much less residue. In reality, it’s the reverse, with less N needed for corn after soybeans. This is a standard consideration with most public N recommendations for growing corn.

The agronomic research literature has plenty of papers on efforts to estimate the amount of N to be supplied by decaying (or ‘mineralized’) soil organic matter and crop residues, and I’ll make no pretense to understand it all nor to summarize it here. However, this information is critically important if farmers and their advisors are to more accurately know how much N will be available from these sources for our current crop – and how much has to be provided by added fertilizer ingredients.

Pre-side-dress soil nitrogen testing (PSNT) is offered as a means for estimating plant-available nitrogen amounts in June in Ontario and nearby states, but I find agronomists to be cautious in its use. There can be major variability in the readings, both spatially and from week to week – as well as in interpreting the results.

Among the public sources of recommendation, as of 2023, there is no adjustment for soil organic matter content in Ontario or the seven states to the west/southwest. Cornell University in New York State provides very detailed recommendations of soil supply for both drained and undrained land for each of more than 600 named soils in the state (available here), but no makes no adjustment for differences in SOM within each soil class.

Greg Stewart has recently introduced an adjustment for differences in soil organic matter in his “Maizex N Tracker” calculator (available as a download here). This is a modified version of the version one of the OMAFRA N calculator described above. Greg’s adjustment is about 12 pounds/acre removed from, or added to, the recommended N application rate for every 1% increase, or decrease, in soil organic matter content.

For a much larger SOM effect, you can check this on-line calculator from Pennsylvania State University (PSU). For our farm’s loam soil (~40% sand, 20% clay) and no cover crops, the calculator says that N need increases by 117 pounds per acre with a decrease in top-soil SOM from 3% to 2%. (PSU cautions that the calculator is still under development. More on the PSU corn N program here.)

I’ll add one more issue – the need/opportunity to adjust the seasonal nitrogen application rate for annual differences in expected yield. In practice, this means adjusting the amount of nitrogen fertilizer to be applied in a late split application (early to mid July) according to the accumulated rainfall to date.

Fortunately, for our farm located near the Elora Research Station with a similar loamy soil, I have the results of an MSc thesis completed recently by Caleb Niemeyer at U of Guelph to use as a guide (available here).

Caleb found high correlations between seasonal rainfall between corn development stages V5 and V12 and both seasonal yields and N required for the full growing season.  This graph shows results for a 10-year study involving continuous corn at Elora. A similar pattern was found in a much larger array of corn-yield/N-response trials at Elora after the year 2000 and at the U Guelph Ridgetown campus from 2009 to 2017. MERN stands for Most Economical Rate of Nitrogen.

2023-03-22 10_28_11-UG ETD Template

Adjustment of seasonal N requirements for this rainfall effect increased the precision of the version-one OMAFRA corn yield calculator from R2 = 0.19 to 0.49. See these graphs below.

2023-03-22 10_28_54-UG ETD Template

Fortunately, late N application is still possible at about stage V12 with modern high-clearance equipment, and Ontario data show no effect of the late application on yield if a sufficient amount of N is also applied at planting time (perhaps 70 to 100 pounds/acre).

The lack of a measured effect of V5-to-V12 rainfall effect on MERN in years before 2000 at Elora is a puzzle. Caleb Niemeyer suggests that it might be caused by greater rainfall variance after 2000 or higher yield levels and vulnerability of higher yields to drought stress.

Unfortunately, we don’t have the same detailed information for most farm soils and locations in the province

A number of models have been developed – and some commercialized – which using soil traits and real-time weather data, to better predict current crop needs and N supply from SOM mineralization. I’ll not attempt to provide an overview, though will note that they mostly get mixed reviews in reports available on the Internet.

One of these, Adapt-N, was developed at Cornell and is in use in Western New York State (including farms a few km from Niagara in Southern Ontario) and the US Midwest. Some references are here and here. Yara now owns the rights to Adapt-N technology. Some quite differing results have been reported as to its possible superiority in predicting best rates of N application in US research (see, for example, here versus here). It is being adapted for use in Southern Ontario by the Ontario-based Deveron company.

It’s not possible for me to give any opinion as to the utility of recommendations provided by Adapt-N or any other modelling approach, but I am trying to learn more, including a 2023 evaluation on our own farm. I am convinced that this is the direction in which grain-crop agriculture must move if we are to do a better job in managing the fourth R for fertilizer N usage in Canada. An interesting new paper by Sulik et al at the University of Guelph also describes the attractiveness of a modelling approach for improving N recommendations for corn.

At a farm information session this winter, a respected Ontario agronomic consultant said that choosing a nitrogen rate for corn is as much about art as science.

She’s right. And we need to change that.

Discussions with many agronomists and soil scientists contributed to the thought process outlined above. However, I would like to acknowledge, especially, comments and advice from Greg Stewart (Maizex Seeds), Caleb Niemeyer (Woodrill Ltd and PhD candidate, University of Guelph) and Dr. John Sulik (Assistant Professor of Plant Agriculture, University of  Guelph). However, none of them bears any responsibility for comments made.

Another Look at Corn/Soybean-Based Crop Rotations and Soil Organic Matter

IMG_20181004_153856_hdr

This is a “WordPress” version of a thread that I posted recently on Twitter. I’ve re-posted it here for the benefit of others – and those who may want to find it again in weeks ahead.

In a 2019 column, I calculated that a corn-soybean-wheat rotation would be better for our farm soil than corn-soybean, but only if the wheat straw was not harvested or if a successful red clover cover crop was established, https://tdaynard.com/2019/02/22/can-we-improve-the-soil-sustainability-of-a-corn-soybean-crop-rotation/
But as I’ve realized since then, that’s not the full story. More here..

First the calculations. Anyone can do them. Take average harvested yields, make assumptions about percent crop residues, ratios of root weight and root exudates, and rates of organic matter decomposition.
More sophisticated models include various soil organic matter (SOM) categories and factor in temps and rainfall…

The data and calculations of average annual residue-plus-root contributions to soil for our farm are as follows:

The balance in favour of C-S-W is stronger if one assumes roots and exudates contribute 2.4 times more to SOM than above ground residues (see Rasse et al reference in earlier article). Our data and calculations are as follows:

But there’s more to it than that:
The same calculation procedure for continuous corn would produce a residue+roots+exudates annual contribution of 17,620 kg/ha (29,950 if roots+exudates are 2.4 times more important). That’s far higher than for any rotation (even if corn yields are somewhat lower with continuous corn because of the lack of rotation)…

But I don’t find this benefit for continuous corn in most published data. For example, Chahal et al (https://www.sciencedirect.com/science/article/pii/S016719872100194X) reported soil organic carbon (SOC, upper 15 cm) of 2.31, 2.31 and 2.24 % for corn-only, corn-soy-wheat, and corn-soy-wheat+red clover after 35 years at the Elora Research Station (ON). The differences were were statistically non-significant…

In the same paper, the data for soil organic carbon after 21 years at Ridgetown ON were 2.67%, 2.53% and 2.58% for upper 15 cm for corn-only, corn-soy-wheat, and corn-soy-wheat+ RC. Again, the differences were non significant…

The same dilemma is evident in this paper by Fan et al, https://www.sciencedirect.com/science/article/abs/pii/S0016706118305755?via%3Dihub (model predictions by a research team at Agriculture and Agri-Food Canada, AAFC):
For a mean annual rainfall of 1000 mm and mean annual temp of 7C (typical South-western ON), their model predicts net SOC accumulation if organic carbon addition is above ~2.5 t/ha (~6t/ha of organic matter)..

So that should mean a dramatic increase in SOM with continuous corn on the Daynard farm with 17+ t/ha annual addition (and for most other rotations on our farm too). Unfortunately, that’s something that we definitely don’t see…

Note that in a more recent paper (https://www.researchgate.net/publication/360921647_Prospects_and_challenges_in_the_use_of_models_to_estimate_the_influence_of_crop_residue_input_on_soil_organic_carbon_in_long-term_experiments_in_Canada) the AAFC team acknowledges that their earlier paper over-estimated SOM increases per tonne of OM addition, but the other models they used also still over-estimate what we see on Ontario farms, in my opinion…

So what's this all mean?
In fact, there is ample literature showing that soil organic matter levels depend on far more than annual dry matter additions.
And it can be quite misleading to estimate SOM rotational benefits based on OM additions only – as I did in the 2019 column. 😒

Originally tweeted by Terry Daynard (@TerryDaynard) on September 19, 2022.

My Comments on: “Reducing Emissions Arising from the Application of Fertilizer in Canada’s Agriculture Sector”

20210503_133643

In spring, 2022, Agriculture and Agri-Food Canada published a discussion paper outlining why and how it proposes to reduce nitrous oxide (N2O) emissions from the application of nitrogen (N) fertilizer in Canada by 30% by 2030. The discussion paper is here. Comments were invited on/before August 31, 2022. For those interested, here are the comments I have submitted.

I have grain farmed near Guelph for 50 years, now growing corn and soybeans with minimal or no tillage, using split nitrogen (N) applications, urease and nitrification inhibitors and variable rate technologies for more efficient N usage. I believe that it is possible to reduce N2O emissions with N fertilizer usage while not reducing yields. Indeed, I think I am achieving this myself using the technologies listed above. Despite this, I believe there are some critical flaws in the proposed federal strategy as described in the discussion document released in spring 2022. These include:

  1. The Canadian annual N2O emission, defined as 12.75 Mt CO2e in the discussion document, comes directly from the National Inventory Report (NIR) submitted to the UNFCCC in April 2021. The current document uses this number to calculate that a reduction of about 4 Mt CO2e is necessary to meet its objective of a 30% reduction in N2O emissions from use of N fertilizer. However, some of the most effective methods for reducing N2O emissions from N fertilizer application come from practices that are not accounted for in Canadian NIR accounting. These include the use of urease and nitrification inhibitors and split-applications of nitrogen fertilizer. Both can be expected to reduce N2O emitted per kg of N applied (though not necessarily total kg applied). Even if thousands of farmers did this, it would not show up in Canadian NIR calculations of N2O emissions in Canadian agriculture.

The discussion document does devote three paragraphs to discussion of the need to correct this flaw and Minister Bibeau made the briefest reference to the same in a recent interview (https://www.producer.com/news/ag-minister-insists-fertilizer-use-reduction-not-on-the-table/). However, neither really addresses how difficult this adjustment will be, given the current rules and procedures for NIR reporting. Indeed, Environment and Climate Change Canada (ECCC) updated its methodology for calculating N2O emissions from fertilizer usage in the 2022 NIR submission, and did not include adjustments for inhibitor usage or for times of application. The reason would seem to be that this was not presently possible using the Tier 2 ecodistrict approach used by Canada, with the accuracy needed for NIR reporting.

Making the adjustment needed to account for the benefit to be provided by the two practices identified above will be very difficult. That is not acknowledged in the discussion document. But without that, changes in practices to reduce N2O emissions in a way that shows up in annual reporting, without affecting agricultural (i.e., food-producing) capacity, will be very difficult – likely impossible. The Government of Canada needs to develop a different accounting method, somewhat independent of NIR, to measure the extent and speed by which Canada approaches a goal of 30% reduction in N2O emissions with fertilizer N usage – or whatever the final reduction goal turns out to be.

  1. The fact that ECCC updated its calculation methodology for the 2022 NIR is a positive. It shows willingness to make changes as new information becomes available. But the magnitude of the changes made with the 2022 reporting, and related discussion in Annex 3.4.5 of Part 2 National Inventory Report 1990 –2020: Greenhouse Gas Sources and Sinks in Canada shows the uncertainty that still exists in N2O calculations for agricultural soils and fertilization procedures. As but one example, the new calculation factors mean a lower N2O estimation when the same quantity of N is provided by manure application rather than by inorganic N fertilizer ingredients. That’s probably correct when manure is applied at about the same time as crop planting and is incorporated immediately, according to published literature. But when manure is applied months earlier – for example, after cereal grain harvest in summer or early autumn to provide fertilizer to be used by a corn crop planted the following spring (a very common practice in Ontario), the N-use efficiency is substantially lower (See http://www.gocorn.net/v2006/Manure/Ontario_Manure_Nutrients_Calculator_2013_ver1_2.xls ).

The point is that calculation procedures for N2O emissions linked to N fertilizer usage are still very crude, and AAFC needs to be very cautious in attempting to make calculations for regulatory purposes. The document states that this is not the intent as of August 2022. But what’s voluntary now can change very quickly by regulatory decision.

  1. Mention should be made, also, of the confusion created when the Government of Canada decided to place emission reductions with N fertilizer usage in a “Nature-Based Solutions” section of its 2030 Emission Reduction Plan (https://www.canada.ca/content/dam/eccc/documents/pdf/climate-change/erp/Canada-2030-Emissions-Reduction-Plan-eng.pdf)  rather than in the agriculture section. This means that any reduction in GHG emission achieved through fertilizer-use management will not show up as a decrease in agricultural emissions as presented by Canada. This decision by Canada adds to the confusion. (I’ve discussed this further at https://tdaynard.com/2022/04/11/trying-to-make-sense-of-canadas-greenhouse-gas-reduction-plans-for-agriculture/ ).
  2. The discussion document makes reference to the economic analysis done for, and released by, Farmers for Climate Change (accessible at link, https://farmersforclimatesolutions.ca/budget-2021-recommendation/#programs). That analysis shows an expected cost of about $47/t of CO2e for emission reductions largely based on three practices, N2O emission reduction, cover-crop usage and pasture management. However when Agriculture and AgriFood Canada (AAFC) announced its new Agriculture Climate Solutions On-Farm Climate Action Fund, in February 2022, the news release stated an expected cost of equivalent to about $90/t of CO2e reduction. That’s almost a 100% increase over the cost calculated by the expert panel of the Farmers for Climate Change. AAFC has made no attempt to explain the large discrepancy; until that occurs, use of the calculations from Farmers for Climate Solutions to justify costs sketched in the current discussion document is not justified, in my opinion.

In summary, most importantly for the reason described above in point #1, but also for also for issues raised in #2, #3 and #4 above, AAFC should not finalize its plan to reduce N2O emissions from N fertilizer usage until a proper and credible accounting protocol is also provided.

Trying to Make Sense of Canada’s Greenhouse Gas Reduction Plans for Agriculture

2022-04-11 11_52_38-Window

This overview has been written for those in Canadian agriculture trying to understand what recent announcements and new funding commitments from Ottawa on net greenhouse gas (GHG) emissions mean for Canadian farmers. The subject is quite confusing; indeed, it’s tempting for agriculturalists to just ‘tune out.’ However, because of the combination of anticipated obligations and the impending availability of financial incentives, I believe progressive farmers need to be well informed. In the following, I’ll try to make the complex as simple as I can while not missing critical details:

  • Agriculture GHG emission accounting has been managed in a confusing manner ever since member countries like Canada began submitting annual ‘Net Inventory Reports’ (NIR) on GHG emissions to the United Nations Framework Convention on Climate Change (UNFCCC) sometime during the 1990s. These NIR calculations are based on reporting protocols specified by the Intergovernmental Panel on Climate Change. What’s classed as ‘Agriculture’ actually includes only a portion of agriculturally related net emissions – specifically, emissions associated with livestock farming, manure, nitrogen fertilizer application, carbon dioxide (CO2) released during urea and lime applications to soil, rice paddy nitrous oxide (N2O) emissions, and a few others. But fossil fuels used in agriculture, energy used for fertilizer manufacturing, CO2 credits for biofuels produced from farm crops and processing byproducts, and net CO2 emissions from the creation and breakdown of farm soil organic matter are not included. Nor is any credit given to agriculture for the carbon contained in farm products sold off the farm – including crop exports to other countries. The oft-quoted ~8% of total national emissions attributed to agriculture – or about 59 M t/year of CO2 equivalent out of the 730 Mt Canadian total according to the most recent data (year 2019, data accessible here) – is an artifact of the calculation procedure. The number would be larger or smaller if various other items were included. I have discussed the significance of this elsewhere (here).
  • In a partial attempt to address this, Environment and Climate Change Canada (ECCC) in preparing NIRs and related reports combines emissions classed by IPCC as agriculture with fossil fuel usage on farms to calculate the ‘Sectoral’ contribution from agriculture. The most recent number is 73 Mt/yr CO2e. However, this summation does not include other agricultural-related net emissions, especially the critical CO2 exchanges between soil and atmosphere that are highly dependent on both type of farming and differences in farm management. CO2 exchanges with farm soils are combined with similar ones from forestry, peat and wetland management and others in a category called Land Use, Land Use Management and Forestry (LULUCF). In the most recent Canadian NIR, agricultural land was a sink (negative net emission) for CO2, equivalent to 4 Mt/yr CO2e, even though the total LULUCF for Canada was positive because of larger emissions contributions from the other components.
  • The Government of Canada added significantly to the confusion with its publication in December 2020 of a major climate change document, A Healthy Economy and a Healthy Environment. In it, ECCC created a category called Natural Climate Solutions (NCS) that is similar to LULUCF but also involves additional agricultural items, including emissions from fertilizer application to farm soils. The choice of the term, ‘Natural Climate Solutions,’ and the high profile given to it were likely political; the term has received strong support in recent years from many NGOs and others. There was a major national ‘summit’ on this in Ottawa in early 2020, funded partly by ECCC. However, the decision to diverge from the IPCC/UNFCCC approach and place several farm-related items in NCS and not ‘Agriculture’ was most confusing to those of us in agriculture.  See the following Table extracted from an appendix to the report (available here), where ‘Natural Climate Solutions’ is relabelled as ‘LULUCF, NBS and agriculture measures,’ with NBS standing for ‘nature-based solutions.’

2022-04-08 09_16_01-Window

  • This brings us to the 271-page 2030 Emissions Reduction Plan issued the Government of Canada on March 29, 2022 (available here) which includes separate sections for both Agriculture and what was earlier called Natural Climate Solutions, now called Nature-Based Solutions (also sometimes referred to in the report as ‘Nature-Based Climate Solutions’). The Agriculture section features the ‘Agricultural Sector’ emission of 73 Mt/yr CO2e (mainly livestock, manure and N fertilizer, plus farm fuel, as stated above), but then says, “Agricultural soils are also a significant carbon sink. In 2019, agricultural soils stored slightly more than 4 Mt, offsetting approximately 6% of total annual agricultural emissions.” The implication is that the 4 Mt amount is included in the Agricultural Sector sum of 73 Mt – which it is definitely not. Indeed, if the agricultural community were to increase the soil sink carbon storage to twice the 2019 amount – say 8 Mt/yr – the Agricultural Sector sum of 73 Mt/yr as calculated by ECCC would not change.
  • Perhaps less critical but still misleading is this statement a few paragraphs later: “Canadian agricultural soils have transformed over the last 20 years from a carbon source to a carbon sink.” That is true if any year before 2000 is used as the base. However, as this graph extracted from the March 2022 document shows, the annual carbon sink storage of Canadian farm soils has mostly decreased in recent years – largely as a result of a declining national beef herd size, and a consequent shift of perennial forages into annual crops. Those who advocate for reduced beef production/consumption in Canada are not allies of efforts to increase the size of the agricultural soil carbon reserve.

2022-04-11 12_00_31-Window


This brings us to the Government of Canada (GoC) commitment for GHG reductions: 

  • In its December 2020 report, the GoC called for no reduction in Agriculture emissions by 2030 – and actually a small increase of 2 Mt CO2e/year to 74 Mt CO2e/year – compared to base year 2005. (See Table above). The projection was also for a 27 Mt/yr CO2e reduction in net emissions in ‘LULUCF, NBS and agriculture measures’ with about 17 Mt of this to come from changes in LULUCF and 10 Mt/yr of the reduction to come from the combination of reduced nitrogen fertilizer use in agriculture and ‘nature-based solutions.’ Based on data in the Canadian NIR (see above; also see here), it appears that reduced fertilizer usage represents about 4 Mt of the 10 Mt/yr.
  • These projected targets for 2030 from the 2020 report were altered only slightly in the document released in March 2022 (here). The 2030 goal for Agriculture was reduced to 73 Mt/yr CO2e for Agriculture from 74 Mt. The 2030 goal for Natural Climate Solutions (aka, LULUCF, NBS and agriculture measures) was reduced to -30 Mt/yr CO2e from -27 Mt. On first glance, Agriculture appears to be targeted for almost no reductions. However, the real agricultural reductions are in the LULUCF, NBS and agriculture measures section, including N fertilizer use reduction and carbon sequestration in farm soils.
  • If you check the fine print in the March 2022 document (See page 214 to 219 in an appendix section called, Modelling and Analysis of Canada’s Emissions Reduction Plan for 2030), you’ll find that the 2022 numbers actually differ substantially from those in the December 2020 report and/or the most recent NIR. For example, the 2030 reduction goal for the LULUCF portion changes from -17 Mt/year to -11 Mt, and the NBS and agricultural measures portion almost doubles, to -19 Mt/yr from -10 Mt.
  • To add to the confusion, the March 2022 document gives almost no guidance as to what is classified as a reduction in LULUCF, or NBS or agricultural measures (the exception being that the 4 Mt reduction for N fertilizer usage is clearly an ‘agricultural measure’). To read the text, it would imply that C sequestration associated with no-tillage and changes in cropping and crop cover would be a ‘nature-based solution’ and/or an ‘agricultural measure.’ However, the Canadian NIR documents make it clear that these are captured in LULUCF. So what’s to be changed and how will the GHG accounting occur? Who knows?
  • Bottom line: The 2030 Emissions Reduction Plan is for a reduction of 30 Mt/yr of CO2e by 2030 for LULUCF, nature-based solutions and agricultural measures, but the document provides almost no information as to what this means beyond vague generalities.
  • There is obviously more to come. For example, note this excerpt from a paragraph on Page 66: “Going Further – the Government of Canada commits to explore additional opportunities, including: …..Advance a Green Agricultural Plan for Canada, in consultation with the agriculture and agri-food sector, Indigenous Peoples, and other stakeholders, to establish a long-term vision and approach to agrienvironmental issues in order to advance the sustainability, competitiveness, and vitality of the sector.”
  • Those who interpret the March 2022 document as meaning little change for agriculture are very mistaken. 

Finally, let’s take a look at programs and funding: 

  • In December, 2020, the GoC initiated an ‘umbrella’ Natural Climate Solutions Fund, committing $3.16 billion to Natural Resources Canada over 10 years to plant 2 billion trees, $631 million to ECCC to “restore degraded ecosystems, protect wildlife, and improve land and resource management practices,” and $98.4 million in new funds to Agriculture and AgriFood Canada to be added to ~$85 million in reallocated money to created a new, $185 million Natural Climate Solutions for Agriculture Fund (NCSAF) (see here and here).
  • In March 2021, AAFC announced more details for NCSAF (including the Living Labs research and outreach program) and added $165.7 million for the Agricultural Clean Technology Program (ACTP) “that supports research, development and adoption of clean technologies.”
  • In the April 2021 Budget, the GoC added $200 million to the now renamed Agricultural Climate Solutions (ACS) Fund – bringing the total to $385 million – and allocated $50 million of ACTP funds for purchase of more efficient farm grain dryers (reference).
  • In December 2021, AAFC clarified that $185 million of ACS will be used to fund Living Labs research over 10 years and $200 million would go to a new 3-year, Agricultural Climate Solutions – On-Farm Climate Action Fund (ACS-OFCAF) “that will support farmers in adopting beneficial management practices (BMPs) that store carbon and reduce greenhouse gases in three areas: nitrogen management, cover cropping and rotational grazing practices” (reference).
  • In February 2022, AAFC announced that $182.7 million of ACS-OFCAF would go to 12 organizations to reduce GHG emissions by up to 2 million tonnes. (This is about double the cost per tonne compared to a recommendation from Farmers for Climate Solutions on which the ACS-OFCAF program was based. No explanation for the doubling was provided.) Usage of the remaining $17.3 million, out of the $200 million, remains unknown.
  • In March 2022, as part of its 2030 Emissions Reduction Plan, the GoC announced another $270 million (to a total of $470 million) to ACS-OFCAF to “allow the program to top-up funding for some current successful applicants, broaden support to additional key climate mitigation practices, extend the program past its current end date of 2023/24, and support adoption of practices that contribute to the fertilizer emissions target and Global Methane Pledge.” The Canadian fertilizer emission reduction strategy is described here. The Global Methane Pledge is an international pledge made in late 2021 with few, if any, details released as of yet for Canadian agriculture.
  • An additional $150 million was announced in March 2022 “for a resilient agricultural landscapes program to support carbon sequestration, adaptation and address other environmental co-benefits.”
  • In its April 2022 Budget, AAFC added “$329.4 million over six years to triple the size of the Agricultural Clean Technology Program” and another “$100 million over six years to the federal granting councils to support post-secondary research in developing technologies and crop varieties that will allow for net-zero emission agriculture.”
  • There is a listing of programs and expenditures for both Agriculture and Nature-Based Solutions, in a final chapter of 2030 Emission Reduction Plan, but it provides no details on delivery plans and expected achievables for the specific programs/expenditures.

Some summary conclusions/opinions: 

  • A substantial amount of money has been committed by Ottawa since late 2020 for reductions in net GHG emissions in agriculture and related areas.
  • There appears to be large expenditures for cover crop establishment for which the underlying scientific support is weak (in my opinion) and for which it will be almost impossible to measure changes in soil carbon storage for many years.
  • I am more comfortable with the approach recently announced by AAFC for nitrous oxide emission reductions associated with fertilizer usage.
  • The steps announced to date for reductions in methane emissions in agriculture (largely related to ruminant animals) are vague and apparently minimal.
  • Curiously, and disappointingly at least for agriculture, none of the federal announcements or commitments refers to opportunities to increase albedo reflectance (the portion of incoming short-wave radiation reflected back into space). Practices such as no tillage and the use of land for annual cropping versus forest cover can mean important increases in albedo percentages. For example, in this recent paper, AAFC researchers concluded that albedo changes caused by no tillage in Prairie Canada have been more important than the associated soil carbon sequestration in reducing atmospheric warming potential.
  • The split of agriculture into two distinct compartments, Agriculture and Natural Climate Solutions (aka, Nature-Based Solutions) is likely to lead to future strategic difficulties for Canadian agriculture. Firstly, the 2030 Emissions Reduction Plan calls for essentially no reductions in net emissions for what it terms as Agriculture, but 30 Mt/yr of CO2e for it calls NCS/NBS. A recent reaction by one prominent Canadian agricultural groups (check here) is an example of what’s ahead. All major reductions proposed for the agricultural/farming sector show up in the main category of NCS/NBS instead of Agriculture, including farm-soil C sequestration and reduced emissions from N fertilizer usage. If Canada increases beef production, the increased methane emissions from ruminant digestions and manure management will show up in the Agriculture leger, while the increased soil carbon storage caused by increased perennial forage production will show up as NCS/NBS. In this recent paper from ECCC and AAFC scientists, soil carbon sequestration from the associated increased perennial forage production was calculated to offset nearly 2/3 of methane and manure emissions caused by Canadian beef cattle.
  • If farmers increase input usage to increase crop photosynthesis, any added emissions from increased input usage show up as Agriculture; increased soil carbon storage shows up as NCS/NBS.
  • To expand on this point, I see future difficulties in two areas – one being journalists, NGOs and public researchers doing quick Internet searchers to see “what Canadian agriculture us doing to reduce GHG emissions” without being aware of the major NCS/NBS component. Another concern involves international ag emission comparisons based on use of data listed in GoC documents like the 2030 Emissions Reduction Plan.
  • I would welcome increased efforts by AAFC and others in the GoC to explain, clarify and (hopefully) correct this source of confusion. A change in reporting to include all of agriculture under Agriculture in future reports would be far better, though I don’t see that as likely, given the dominant role of ECCC and its many eNGO friends. (Any weakening of the scope of NCS/NBS is likely to be viewed unfavourably by them.)
  • Also welcomed would be considerably more detail on how all the money committed to GHG reduction in agriculture, since late 2020, is to be used.

Please notify me of any errors – typos (which are my specialty) and other errors – at TerryDaynard@Gmail.com . Thanks.

2022 Update: What are the Realistic Opportunities for Reducing Greenhouse Gas Emissions in Canadian Agriculture?

IMG_20171008_154435

About a year ago, I posted an analysis about why and how Canadian agriculture might reasonably reduce greenhouse gas (GHG) emissions. Because of some notable events and advancements during the past year, I am providing this update. I start with an overview of what’s happened internationally and then focus on soil fertility and nitrous oxide (N2O) emissions, and on soil management and soil carbon/CO2 sequestration. There are promising opportunities to reduce GHG emissions via the former, but enthusiasm likely exceeds reality with the latter.  I add a very small amount at the end on agricultural methane and on developing trade in GHG agricultural credits.

Intergovernmental Panel on Climate Change, and Glasgow Conference

  • Working Group I (WG I) of the Intergovernmental Panel on Climate Change (IPCC), responsible for summarizing scientific information on the physical basis of climate change, issued its Sixth Assessment report in October 2021. The WG I full report is about 1300 pages and will likely be read in its entirety by very few people. However, a 40-page Summary for Policy Makers (SPM) is available (accessible here). The SPM is dominated by discussion on models of expected temperature changes using various assumptions about future greenhouse gas (GHG) emissions. A middle-of-the-road WG I model predicts a global average temperature about 2.0 to 3.5 C higher in 2100 compared to the average for years 1750 to 1800. A weakness in the projections, in my view, is uncertainty in the extent to which the measured global temperature increase of 0.8 to 1.3C to date (two-thirds certainty) since 1750-1800 is the result of planetary heating caused by GHG gases in the lower atmosphere, and/or cooling by emissions of particles and other gases into the upper atmosphere. WG I says it is two-thirds certain that human-caused GHG emissions have been responsible for a 1.0 to 2.0 C increase in average temperature to date, with upper-atmosphere contaminants causing a cooling of 0.0 to 0.8 C. Despite that uncertainty, WG I concludes, “It is unequivocal that human influence has warmed the atmosphere, ocean and land.”
  • The other big international event in 2021 was the United Nations Climate Change Conference in November, commonly referred to as COP26. One conference outcome was a series of long-term government commitments for achieving zero net GHG emissions several decades in the future. Because of the vagueness in how these reductions are to be achieved, there are many doubts about the value of these promises by politicians. (The Government of Canada has yet to meet any of its previous commitments for GHG reductions.)
  • Most media reporting, so much of which focuses on abnormal (often labelled “extreme”) weather events, has not been very helpful in advancing public understanding of the fundamentals of climate change. Climate change is usually measured by scientists as changes in 30-year averages and related long-term trends, not short-term peaks. However, media exuberance has probably been effective in encouraging many people to demand that governments ‘do something.’

Nitrous Oxide (N2O)

  • Discussion about total Canadian agricultural GHG emissions can be found here and here. About 42% of what are counted as Canadian agricultural GHG emissions using IPCC calculation protocol involve direct emissions of N2O from soil. Half of that comes from the application of synthetic nitrogen fertilizer (mostly) and farmyard manure. Further, the release of N2O from Canadian soils fertilized with synthetic N has increased by about 60% since 2005 – the biggest increase over that interval among all identified Canadian agricultural sources of GHG. The Government of Canada in a broad policy statement on climate change and GHG in December 2020 announced a 10-year commitment to reduce N2O emissions from fertilizer usage by 30% . (See also here.) This has prompted lots of discussion on how to do this and the implications of doing so. A national media campaign by Fertilizer Canada promoted a message that implementation of the 30% reduction would mean a $48 billion loss in Canadian farm income over eight years (see here and here).
  • The IPCC GHG calculation protocols offer three routes for countries to calculate emissions from N2O usage (or indeed any GHG emission source). These are labelled Tier 1, 2 and 3, with a higher number meaning an increasingly detailed calculation procedure. The Tier 1 calculation for N2O involves the simple assumption that every kg N fertilizer applied to soil results in an emission of 0.01 kg of N2O-N. The 0.01 ratio is termed an emission factor. With Tier 1 calculation, the only way to achieve a 30% N2O reduction is to reduce total domestic N application by 30%.
  • Canada uses a Tier 2 calculation procedure (see Section A3.4.5,Part 2, Government of Canada National Inventory Report, accessible here), which to date has been based largely on a review of literature published by Rochette et al (2008). The current N2O Tier 2 calculation for Canada divides Canada farmland into three main zones (two for the Prairies and one for Ontario and Quebec) each with a base emission factor, and then further into 405 ‘ecodistricts.’ Within each ecodistrict, the emission factor is adjusted for differences in predominant soil texture (higher emission factor for fine-textured soils), topography (higher for lower-lying soil), and the calculated ratios between use of manure versus synthetic N fertilizer. There are other adjustments for use of irrigation, for N2O emissions during the non-growing season, for use of biosolids, land in summer fallow and no tillage. (No tillage means more N2O release in the East compared to conventional tillage, and less in the West – a function of the effects of soil moisture.)
  • Recent follow-up papers by Rochette et al (2018) and Liang et al (2020) suggest changes are likely in Canada’s Tier 2 emission factors for N2O. However, there is no specific reference in these papers to adjustments for timing of N application, differences in fertilizer placement, or the use of urease and nitrification inhibitors – i.e., three-quarters of the ‘4R’ N2O reduction strategy promoted by Fertilizer Canada.
  • An obvious farm management option is to reduce total N application rate per acre/ha. Research and extension articles by Dr. Weersink, De Laporte and colleagues at the University of Guelph have indicated that N application rate could be reduced most years without notable loss in income. (See here and here.) However, long-term research by Dr. Bill Deen and colleagues at the Elora Research Station (see here) shows that the optimal N rate can vary by 70% from year to year. And some of the analyses by Weersink and De Laporte involve using crop yield data for a given year to calculate the amount of N that should have been applied to the same crop a few months earlier. That’s only possible in computers. Also, calculations based on small plot data generally don’t take into account within-field variation in N fertility needs for those farmers (i.e., most) who apply a single rate of application for the whole field.
  • Variable rate N application could address both problems. Data from US research (see, for example, here, here and here) shows that optimum N requirement decreases with increasing soil organic matter amount. The extra N in high OM parts of the field comes from greater ‘mineralization’ (OM breakdown) which releases plant-available N. The concept can be difficult for a farmer to grasp – more N fertilizer needed in ‘poorer’ parts of the field (‘poorer’ meaning lower yield expectation because of lower soil OM content) – but it may be a means for farmers to reduce average rates without visible N deficiency symptoms in greater-need parts of the field. The US data suggest a reduction in N applied of 15-20 kg N/ha for every 1% increase in percent SOM.
  • Another equally large problem is the seemingly impossible task of adjusting springtime N application rates for subsequent annual differences in corn yield (usually the result of differences in summer rainfall). Banger et al (2020) express the challenge well: “Results of this study further suggest that farmers need to adjust N rates depending on the weather in a growing season.” But how?
  • To this end, analyses summarized by Nasielski and Deen (see slides 10 to 12) show high correlations between seasonal rainfall from mid-June to mid-July and optimal seasonal N need. It should be possible to vary the rate of N application with split applications, with the second half of the split occurring after July 15 – and with less N applied in July when rainfall is below normal during the previous month. Data from Nasielski et al show that the late split application should not affect crop yield compared to normal June side-dress application.
  • The most important practice for reducing N2O emissions from fertilizer application without hurting yield is the use of urease and nitrification inhibitors. Data such as those summarized by Dr. Tom Bruulsma here show that the use of these inhibitors alone could reduce N2O emissions from fertilizer usage by 20 to 40 percent. See also, this paper from Wagner-Riddle’s team at the University of Guelph. Hopefully, future Canadian policy designed to reduce N2O emissions from fertilizer usage will include this technology, even if the effect does not show up in Tier 2 NIR calculations as they exist now. In the United States, the Environmental Protection Agency has indicated that it is considering including inhibitor reductions in future versions of its Tier 3 estimates of N2O emissions associated with soil fertility (see here). While N2O emissions are very important for GHG calculations, they are generally too small to have implications for farm profitability (reference here).

Soil Carbon Sequestration

  • There continues to be a major gap between the opinion of many farmers and agronomists that cover crops increase the organic matter content of Canadian soils, and hence are valuable for carbon sequestration – versus the scarcity of supporting data. For example, Morrison and Lawley, 2021, in a survey of Ontario cover-crop users, found that 68% of the 530 Ontario famers who responded to survey on cover crop usage considered cover crops to be an important method of ‘building soil organic matter.’ In contrast are data reported by Chahal et al (2021) for 36-year and eight-year research studies at Elora and Ridgetown ON, respectively, showing zero effect on soil organic matter (SOM) content from the inclusion of red clover in corn-soybean-wheat crop rotations.
  • Van Eerd, Chahal and colleagues have two adjacent long-term cover-crop experiments at Ridgetown featuring horticultural crops, and have reported substantial increases in SOM. See, for example, this statement in a recent issue of Ontario Grain Farmer magazine, “So far, we have found cover crop species had 11 — 22 per cent greater soil organic carbon storage when compared to the no cover crop control”. The published research data are here. However, these researchers also collected soil samples from the same plots at the same time and sent them to a lab at Cornell University for analysis. Those data published here show a range of increased SOM from minus 3% to plus 11% increase across cover crop treatments and tests, with the 11% increase in one test – the only one statistically significant – being a comparison involving cereal rye cover. There were no significant differences with the use of oats or oilseed rape alone as cover crops. Despite this discrepancy between data sources, the overall numbers do support their conclusion that cover crops can increase SOM in a horticultural crop rotation. With some horticultural crops, the length of the cover crop growing season is substantially longer than with corn or soybeans. However, this explanation does not explain the lack of a SOM benefit with red clover seeded into winter wheat in early spring.
  • Part of the differences reported for effects of cover crops on SOM may involve differences in definition. The most common international definition is this from the Soil Science Society of America, “A cover crop is defined as a close-growing crop that provides soil protection, seeding protection, and soil improvement between periods of normal crop production.” However, a broader definition (see, for example, here) is used sometimes in Western Canada, “A cover crop is grown to cover the soil, at times when the soil would otherwise be left bare.” This would mean ‘green-manure crops’ (crops grown by themselves for the full season) grown to replace summer fallow and perhaps supplying some summer/autumn grazing would be classed as cover crop. While summer fallowed ha are far fewer in number now in Canada compared to years past, I note that nearly half of the respondents to a survey of Prairie farmers by Morrison and Lawley (2021) involved cover crops where no other crop was grown the same year. Finally, an even broader definition seems inherent in this statement from the Ontario Cover Crop Strategy, “[Cover crops are] plants seeded into agricultural fields, either within or outside of the regular growing season, with the primary purpose of improving or maintaining soil quality.” This would seem to include all green manure crops and even multi-year forage crops (eg., perennial legumes grown in ‘ley’ years to accumulate soil nitrogen reserves on organic farmers)  Hence, the extent to which cover crops increase SOM likely depends on definition.
  • For more discussion on the uncertain value of cover crops for increasing SOM, check here, here and here. Doubts about the value of cover crops for increasing SOM do not extend to their other proven benefits. These include reducing soil erosion, improving rainfall penetration, creating deep soil channels for improved drainage and crop root penetration, storing soil nitrates during off seasons when they might otherwise cause off-site pollution, and, in the case of legume cover crops, fixing atmospheric nitrogen (extensive review here).
  • The Government of Canada announced in its 2021 federal Budget the creation of a new $200 million Agricultural Climate Solutions program. One of the three target areas is expanding cover crops as a means of sequestering soil carbon. The rational for doing so, explained here, is based on a relatively small number of Canadian measurements, several of which involve green-manure crops. I would love to be proven wrong, but must respect available research findings, and am skeptical that this expenditure will result in much C sequestration. I am not opposed to encouraging expanded cover crop usage because of all of the other contributions to farm well-being as listed above. (Note that a February 22 news release from Agriculture and AgriFood Canada provides more detail – $183 million to be distributed via agreements with 12 Canadian agricultural organizations – with more information to come in the weeks ahead.)
  • Debate continues on the value of no-tillage in increasing SOM. This benefit is quite consistent in data from the Prairie Provinces (references here). As a result, no-tillage is recognized in calculations of Canada’s soil carbon sequestration in National Inventory Reports (see reference above). However, the data are far less consistent for Ontario and east; typical results often showing yield reductions with no-tillage – primarily because of cooler spring soil temperatures, especially for corn – and no improvement in SOM. (Extensive discussion can be found here.) However, Shi, Drury and colleagues at Agriculture and Agri-Food Canada, Harrow ON, found no yield reduction and a 12.5% increase in SOM after 16 years with the use of pre-plant ‘zone tillage’ (aka ‘strip tillage’) in a 21-cm zone centering on each corn row. This subject requires more research but may provide a means for extending Western Canadian-type SOM benefits to ‘partial no-tillage’ for Ontario and provinces east. It’s worth emphasizing, too, the importance of deep soil sampling when assessing the true SOM benefit from no tillage, given that research almost always shows that no tillage increases the SOM in near-surface soil, but reduces it at depth.

Methane

  • I’ve little of value to add on methane from ruminants other to than to applaud progressing strategies for reduced methane production using feed additives and genetics. I note that Verra, a major US carbon credit certifying organization, has initiated steps to issue ‘carbon credits’ for using methane-reducing feed additives (reference here).

Trade in Carbon Credits

  • This is a rapidly developing marketplace, with the potential for major economic benefit to farmers employing new practices to sequester soil carbon and/or reduce GHG emissions. However, it also represents potential danger in that cash paid for miscalculated benefits may need to be paid back at some future date – even decades into the future. Here is a great review and analysis by the Environmental Defense Fund in the US.

Thank You

Many people have contributed to the information and/or thinking expressed above (though I alone take responsibility for errors and omissions). I thank Dr. David Burton, Dr. Tom Bruulsma, Dr. Inderjot Chahal, Dr. Bill Deen, Dr. Aaron De Laporte, Dr. Ray Desjardins, Dr. Craig Drury, Dr. David Hooker, Ken Janovicek, Dr. Joshua Nasielski, Caleb Niemeyer, Greg Stewart, Dr. Laura Van Eerd, Dr. Claudia Wagner-Riddle, Dr. Alfons Weersink and others whom I’ve neglected to mention.

Please notify me at TerryDaynard@gmail.com if you spot errors – typographical and other – in this posting. Thanks.

A Brief History of Corn in France: How the Church Suppressed Corn Expansion for More than 250 Years

20220122_143637

A little over 45 years ago, equipped with not much more than strong curiosity, a list of contacts and my inadequate high-school French, I spent 3 weeks visiting corn researchers, farmers, and the Association Générale des Producteurs de Maїs (AGPM) in France. At that stage in my career I had spent 10 years in corn research and agronomy in Canada and the United States. But I had come to realize that the Canadian growing season for corn is actually more similar to France than most of the United States. It was time to learn more from our cross-Atlantic colleagues.

That trip was highly rewarding and four years later, I spent additional weeks there.

Not only did I experience an agriculture and corn culture notably different from that in Ontario, I was also seeing a French corn industry – as I realized years later – in the midst of major change.

I also met Jean-Pierre Gay, a corn geneticist/breeder and agricultural historian, who later gave me a copy of his new book entitled Fabuleux Maїs, histoire et avenir d’une plante, published by AGPM in 1984. It’s a history of corn from its very beginnings in Mexico to the early 1980s in France.

I was busy at the time, and still had only a rustic ability in French, so the book was skim-read briefly and put on a shelf. Now, almost 40 years later, I’ve had time to read Gay’s book completely – parts of it several times – and what I’ve discovered is one of the best chronicles of corn history I’ve ever read.

Fabuleux Maїs is full of details on the beginnings of corn in Meso-America, and its rapid establishment throughout many parts of Europe and Africa after Columbus’s journey in 1492. The history of corn in France is especially intriguing.

The book is available from Amazon, but only in French and only in non-electronic form (no option for Google Translate). So, for the benefit of those with no French language skill or who lack the time to read the full 296 pages, I’m providing the following brief summary. I’ve also added a small amount on corn advancement in France after the book was published (or at least the part with which I am personally familiar).


Corn Comes to Europe

Metallic gold was what the early Spanish explorers sought during their visit to the New World in 1492 and the years immediately thereafter. But the real gold they discovered is what we in English-speaking Canada and the United States call ‘corn’ – and ‘maize’ in other Anglophone countries, ‘maїs’ and ‘maiz’ in French and Spanish,  Zea mays by scientists, and by dozens of other names around the world. Apparently, the original name in Europe might have been ‘mahiz,’ a name used by Cuban indigenous people who were likely the first corn growers that Columbus encountered.

(I am using the term ‘corn’ in this article for the simple fact that that’s the name with which I’m most familiar, and probably the term used by most of my readers, as well.)

Columbus brought corn back to Spain, and there is good evidence that white Caribbean flint corn was grown near Seville in southern Spain in 1494 AD.

Though Seville is far south in Europe, it’s still well north of Cuba, and given corn’s  high photoperiodic sensitivity, it would have been very late in maturity (and quite tall). But that it was a success is shown by the rapidity with which its culture expanded through much of Mediterranean basin, and into Balkan countries to the north and east a few decades later.

Though the details are beyond the scope of this article, corn was also spreading rapidly elsewhere at the time. There is record of it in Indonesia in 1496, with early arrivals in India, The Philippines, South-east Asia and China). Portuguese traders and slavers were responsible for the first spread into Africa about 1550.

Gay says in Fabuleux Maїs that the original Caribbean flint corn was infused relatively quickly with imported corn varieties from Mexico including shorter-season varieties from the highlands, but no details are provided.

Interestingly, one of the first European visitors to what’s now known as Canada and the United States was a Frenchman, Jacques Cartier, who in 1535 travelled as far west present-day Montreal and reported encounters with corn-growing people along the St. Lawrence River including well east of the present Quebec City. However, there is no record of Cartier bringing back corn seed to grow in Europe. Of note, those St. Lawrence River farmers were all gone when Samuel de Champlain and other French explorers arrived again after 1600. (They are believed to have been members of the Mohawk and/or Onondaga nations who by 1600 were located near Lake Champlain and lands to the south and west.)

The spread of corn through the Old World was remarkably rapid though with few or no formal records kept of details, so that there was later confusion as to its origin. Corn was often referred to, in various languages, as ‘Turkish wheat’ with that country assumed to have been its original home. Some authors claimed there are references to corn growing going back to the ancient Egyptians and also in the writings of Homer (Greece) and Pliny The Elder (Roman). The assumption of an Old World origin was not that uncommon for a century or more to follow Columbus’ travels.

Corn Arrives in France
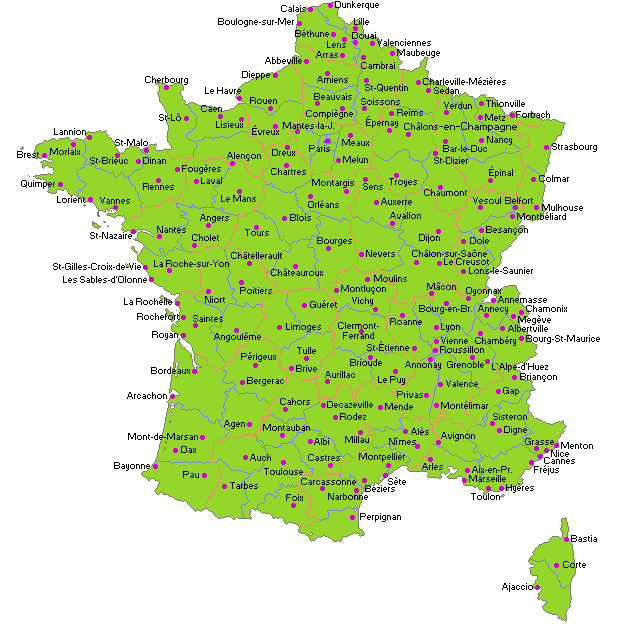
2022-02-04 16_36_13-MAP OF FRANCE CITIES - France map with cities and towns

Map of France

With France, the story is a little different. The first record of corn there dates to 1523 in the Basque country, near the towns of Bayonne and Biarritz and in nearby French Béarn (extreme southwest, near the Atlantic, a few km from Spain). But the spread beyond there was slow and largely through the rugged poorer farmlands to the east and north-east of Toulouse.

There is also a lot of confusion about the early progress of corn growing in France as it was commonly referred to as millet, and confused with the grain of African origin with the same name – and sometimes with sorghum too. Thus, unless accompanied by a drawing or some reference to grain size, there is no way of being sure which species is being referred to in sporadic records from the south of France for a period of 100-150 years or more.

Corn did enjoy early popularity in extreme southwestern France. There is a record of 1000 tonnes being exported from this area to Spain in 1774. It formed about 70% of the local human diet – commonly accompanied by pellagra, a deficiency disease caused by the low content of the amino acids lysine and tryptophan in grain corn. (Indigenous American nations were subject to the same disease though generally countered it with co-consumption of beans, meat and fish.)

But beyond very southwestern departments, corn was very slow to become a common crop in most of France.

Corn did spread as far as Alsace in 1637 where it was called, interestingly enough, “Welsch korn.” There is some evidence (though not in Gay’s book) that this was the result of a second early entry of corn into southeastern France from northwestern Italy.

But French corn production remained tiny. The reasons for the slow spread were several:

One was that corn was not considered healthy to eat – perhaps linked to the pellagra problem, but also the generally impoverished and unhealthy condition of most people who lived in what was then regarded as a very backwards part of France. Unless humans were forced to eat corn, it was generally reserved for livestock feeding, with humans opting for foods produced from wheat (mainly) but also other small-grain cereals.

The more productive lands for grain production in France are generally in the west, north-central and north, where wheat and similar cereals reigned supreme.

By far the biggest obstacle seems to have been the church and a practice called ‘la dîme.’ (I don’t know the equivalent English name, if there is one.) La dîme was an historic practice by which farmers (mostly tenant farmers) paid a set amount per unit of land area to the church for the right to grow various crops. There were fixed per-ha rates for wheat, rye, barley, all the common food crops, but none for the ‘new’ crop corn. In return, the church discouraged the production of corn in various ways. The discouragement included spreading misinformation about its unhealthiness and association with poverty.  Because much of the land was owned by large landowners who wanted to be assured of ultimate salvation, many of them inhibited corn growing on rented lands.

There were efforts made to pay the church amounts in lieu of the dîme. And though this might seem like an obvious solution, efforts to introduce a dîme for corn did not prove popular (one reason being that some farmers and landlords saw corn as a legal – though frowned-upon – way of avoiding the payment to the church).  The dîme was one reason why those in agriculture many have deliberately confused corn with millet and sorghum  – though I am not sure of the historic status of true millet or sorghum as dîme-requiring crops.

The result was that peasant farmers were allowed, generally, to grow a small amount of corn without hassle, but when it came to represent a substantial portion of cropped land, a visit from a church official was inevitable.

I have not seen information as to which ‘church.’ Though French Protestant  Hugenots were still common in southern France for part of that era, I assume the dîme was a Roman Catholic practice.

My understanding is that the practice of dîme payments pretty much disappeared during the French Revolution in 1789, but the die was cast: grain corn was not considered a proper crop to grow in much of France – much less to eat – for up to four centuries after its first arrival in 1523. That continued well into the twentieth century.

Hence, land surface area devoted to corn did not grow consistently. According to author Gay, in 1840, 532,00 ha of corn were grown in France. But by 1943, that had declined to 217,000 ha, with half of that grown in two (out of a total of 96) French departments in the extreme southwest.

Beginning of  the Modern Era for Corn in France

An important event occurred in 1930 in Pau, France – the Congrès International du Maїs, organized by a railroad company, la Compagnie des Chemins de Fer du Midi. (Why a railroad company sponsor? Author Gay says he does not really know.)

The Congress that emphasized the revolution on corn breeding then underway in the United States was a major success. Two years later, a corn genetics/breeding research station was established at Saint-Martin-de-Hinx (near Bayonne), and two years after that, in 1934, the Association Générale des Producteurs de Maїs (AGPM) was founded, based at Pau.

Although breeding efforts at Saint-Martin-de-Hinx continued through World War II, most other Congress-related activities including further development of AGPM stopped. AGPM was revived again in 1947 and a second international AGPM-led congress was held at Pau in 1949. This time the emphasis was mostly on hybrid corn and its success in the United States.

As a result, the production of hybrid corn and number of planted ha of grain corn grew rapidly, reaching 300,000 ha in 1948-50, with an average yield of 1.8 t/ha, to 600,000 10 years later and an average yield of 2.8 t/ha. (For those who think in bushels and acres, that’s about 45 bu/acre.)

The hybrids grown initially were exclusively of US origin, which led to two issues: 1) they were very late in maturity and adapted only to extreme southwestern departments, and 2) they were American.

There were many debates about whether corn grown from US hybrids was safe for the soil or to eat. There were complaints that US was actually foreign territory for corn and that emphasis should be on corn varieties from what locals considered to be its locally assumed ‘centre of origin’ – the Basque country and nearby Spain. There were also debates on whether the higher productivity with hybrids was a good thing. Hybrids took more skill to grow (less vigorous at the beginning than local open-pollinated varieties and required more fertilizer), and produced more corn than some farmers needed. (“After all, farmers have been able to grow enough feed for their animals using the older varieties,” some said. “Why change?”)

Nevertheless, corn continued to expand – at least in warmest parts of the country. The hybrids were too late in maturity to be grown on the better France farmlands generally in the north, north-central and western parts of the country.

The first use of the herbicide, simazine, occurred in 1958 and this also encouraged corn expansion, especially with other herbicides to follow.

IMG_0240

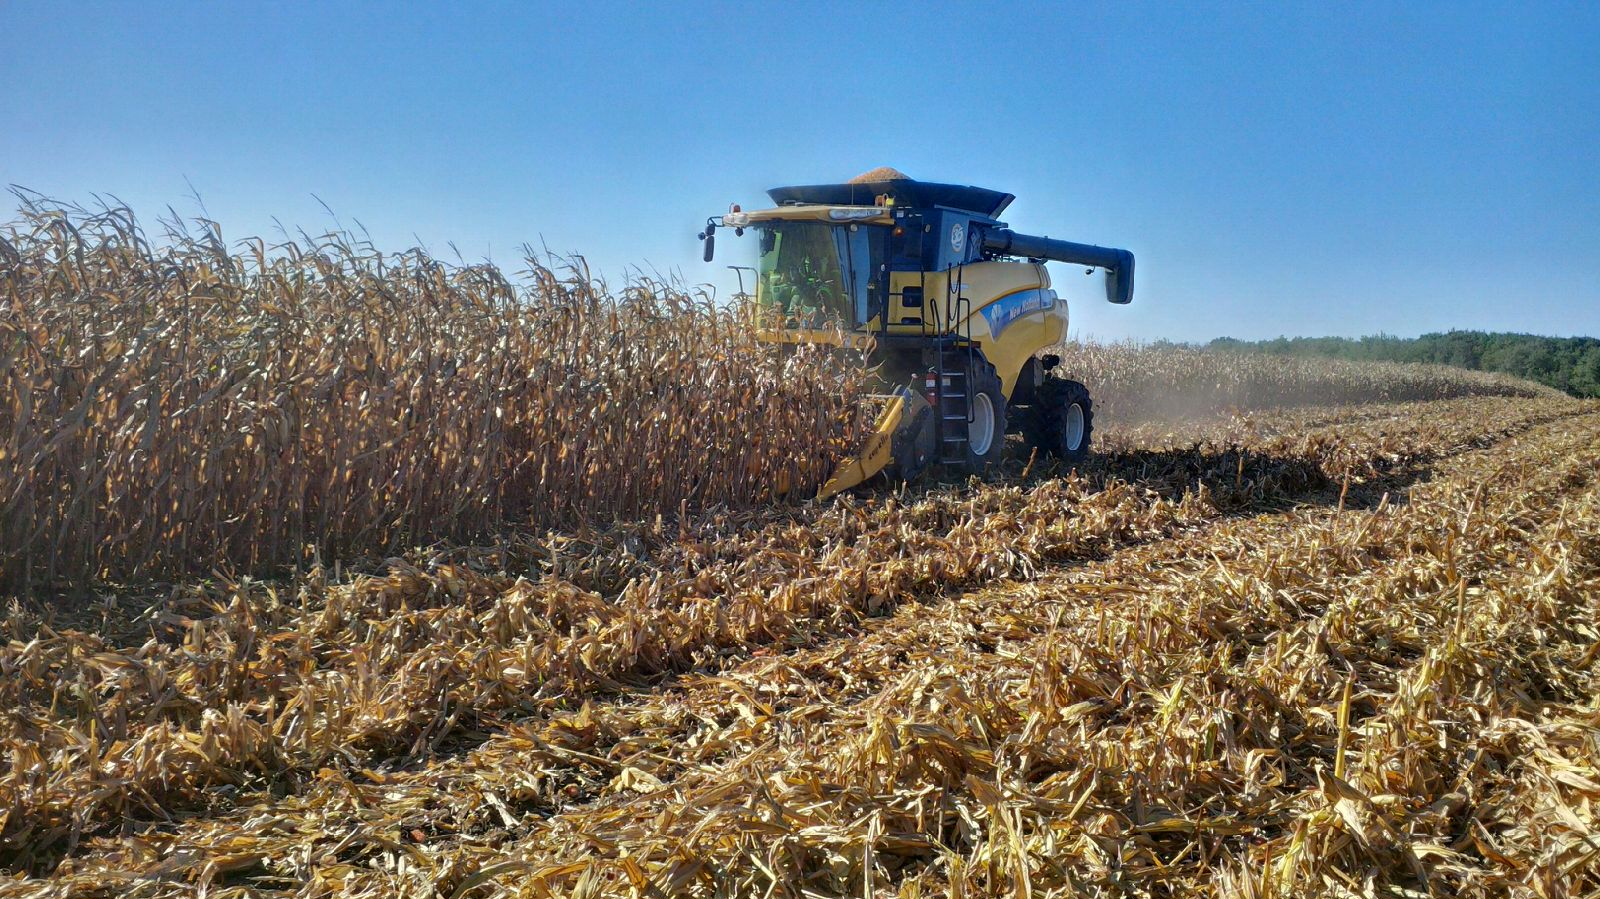
Rugged farmland (and small town) north-east of Toulouse near where the flint variety, Lacaune originated

Major breakthroughs occurred soon after World War II. The first involved an obscure open-pollinated flint variety called Lacaune developed by farmers in the high-elevation (and comparatively cool) department of Tarn northeast of Toulouse. Successive generations were grown at high plant densities, resulting in a population of corn that was cold hardy, early maturing and tolerant to high plant densities.

Some seeds of Lacaune found their way to the INRA research program at Versailles (INRA stands for Institute National de la Recherche Scientifique), where a few generations of selection resulted in two inbreds, F2 and F7, that were released in 1946-47. The single cross, F2 x F7, was a flint hybrid with the same characteristics as Lacaune and good yield in its own right, but also of high heterotic vigour when crossed with early-maturing dent inbreds from the United States.

INRA released several flint-dent hybrids beginning in 1957, starting with INRA 200 and followed by INRA 258. Both were double-cross hybrids involving pairs Wisconsin inbreds and their single-cross, crossed with F2 x F7 (or F7 x F2, female parent listed first). INRA 200 and 258 were early enough in maturity to be grown as far north as Paris – permitting corn to mature for grain on these better French soils.

The Famous Hybrid, LG11, and Even Better Ones to Follow

This, in turn, led to the release of hybrid LG 11 in the late 1960s, by the cooperative Groupe Limagrain, based at Clermont-Ferrand. LG11 had the same Wisconsin-inbred/F7 x F2 parentage. LG 11 proven to be immensely popular and, along with the INRA hybrids, was responsible for a major expansion of corn production into the Loire River region of France, and northward, beginning in about 1970. Though I don’t have precise data, my understanding is that LG 11 may have represented 40% of French corn hectares during the mid 1970s.

I grew LG 11 myself and some other early-maturing French hybrids during the late 1970s in cooperative trials across Canada and France. We were interested in how the two groups compared in different environments. The flint-dent French hybrids generally had more cold tolerance in spring but were notably slower to dry-down in autumn. Some of these French hybrids were promoted for use on Canadian farms but the slow dry-down proved to be a major obstacle to farmer acceptance. The cold hardiness was attractive in Canada, but not so much as in Western Europe. (Canadian spring weather goes from cold to hot quite quickly, compared to the long, cool springs common across the Atlantic.)

The success of LG 11 in France prompted other French and American companies to consider related ventures and what followed were a number of joint ventures including France Maїs, a partnership with Pioneer based near Blois on the Loire River, and RAGT, a partnership with DeKalb, based at Rodez, north of Toulouse. One of the major developments was the hybrid Dea, a single-cross between a North American dent inbred and F2, released by France Maїs/Pioneer in 1981. Dea represented a large improvement in productivity (yield and stalk quality) and was widely popular, securing a major presence for Pioneer in France as well as continued expansion of corn production to the north.

One company that did not partner much with any North American partner was Groupe Limagrain. It continued to expand in France and then into North America. The former King Grain corn program based at Paincourt Ontario, marketer of Pride Seeds in Canada, is now part of AgReliant Genetics owned by Groupe Limagrain and Germany-based KWS.

(One of my most pleasant memories was that of serving as external examiner for a doctoral thesis defense of a Limagrain agronomist at the Université Clermont-Ferrand in about 1982. I don’t remember much about the thesis but I sure do remember the party to follow.)

My history stops here because I am not as familiar with the details of French corn development after I left the University of Guelph and joined the fledgling Ontario Corn Producers’ Association (OCPA) in 1983-1984.

It’s worth noting that my experience with AGPM was one of the reasons why I was so keen on the establishment of OCPA.

My impression is that French hybrids have become more dent like, and less flinty, with time – driven no doubt by a desire for faster dry-down in autumn and greater use of North American germplasm in corn breeding programs.

And French corn hectares have continued to grow, reaching 2 million ha in 1988 though with a gradual decline to about 1.5 million since then. The decline may be partly attributable to the inability of French farmers to grow transgenic hybrids with genes added for insect control and tolerance to glyphosate herbicide (very valuable in no-till agriculture).

I’ll close my brief history with an anecdote. When I visited France in 1975, I spent one late-August evening meal with an INRA corn breeder and his family in Montpellier. Before we left his research plot area for the day, he went to the very back of the research field and collected some ears of sweet corn – well hidden by taller corn nearby. At his home, he carefully closed the shutters before they boiled the ears for eating. It sure tasted good, but they didn’t want any neighbours to know we were eating corn.

Now you can buy sweet corn for eating anywhere in France. I saw several recent tweets from France promoting ‘popcorn’ (same word in French as English).

And I haven’t seen anything of late from the Catholic church condemning corn eating and corn farming.

Times change.

I express my deepest appreciation to Jean-Pierre Gay and his outstanding book Fabuleux Maïs, histoire et avenir d’une plante, which is the source of 99% of the information presented in this article. Thank you also to Mr. John (Jack) Watson of Des Moines Iowa, formerly of Pioneer International, who established the Pioneer/France Maïs corn breeding program near Blois and provided some information on the post LG 11 era. I thank l’Association Générale des Producteurs de Maїs for sponsoring Mr. Gay’s book and for its leadership in corn advancement.

IMG_0168

Le Mont-Saint-Michel, Normandie, not a corn picture but one of my favourite views in France

Do Canadians Really Lose or Waste 58% of Food and Food Ingredients? A Critical Look at the Calculations Says No

20211017_134748
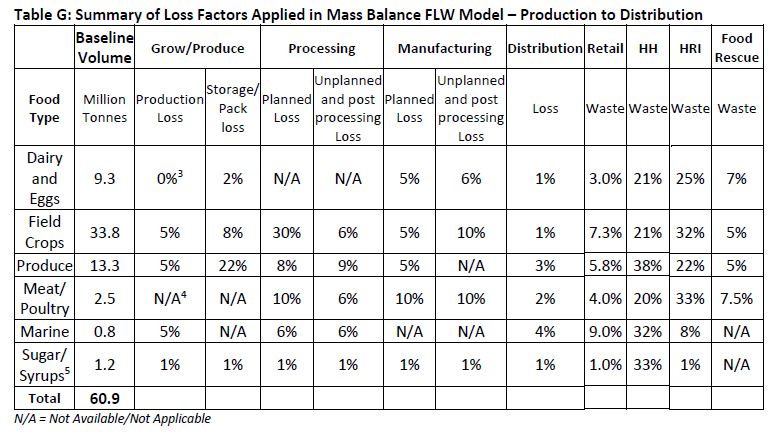
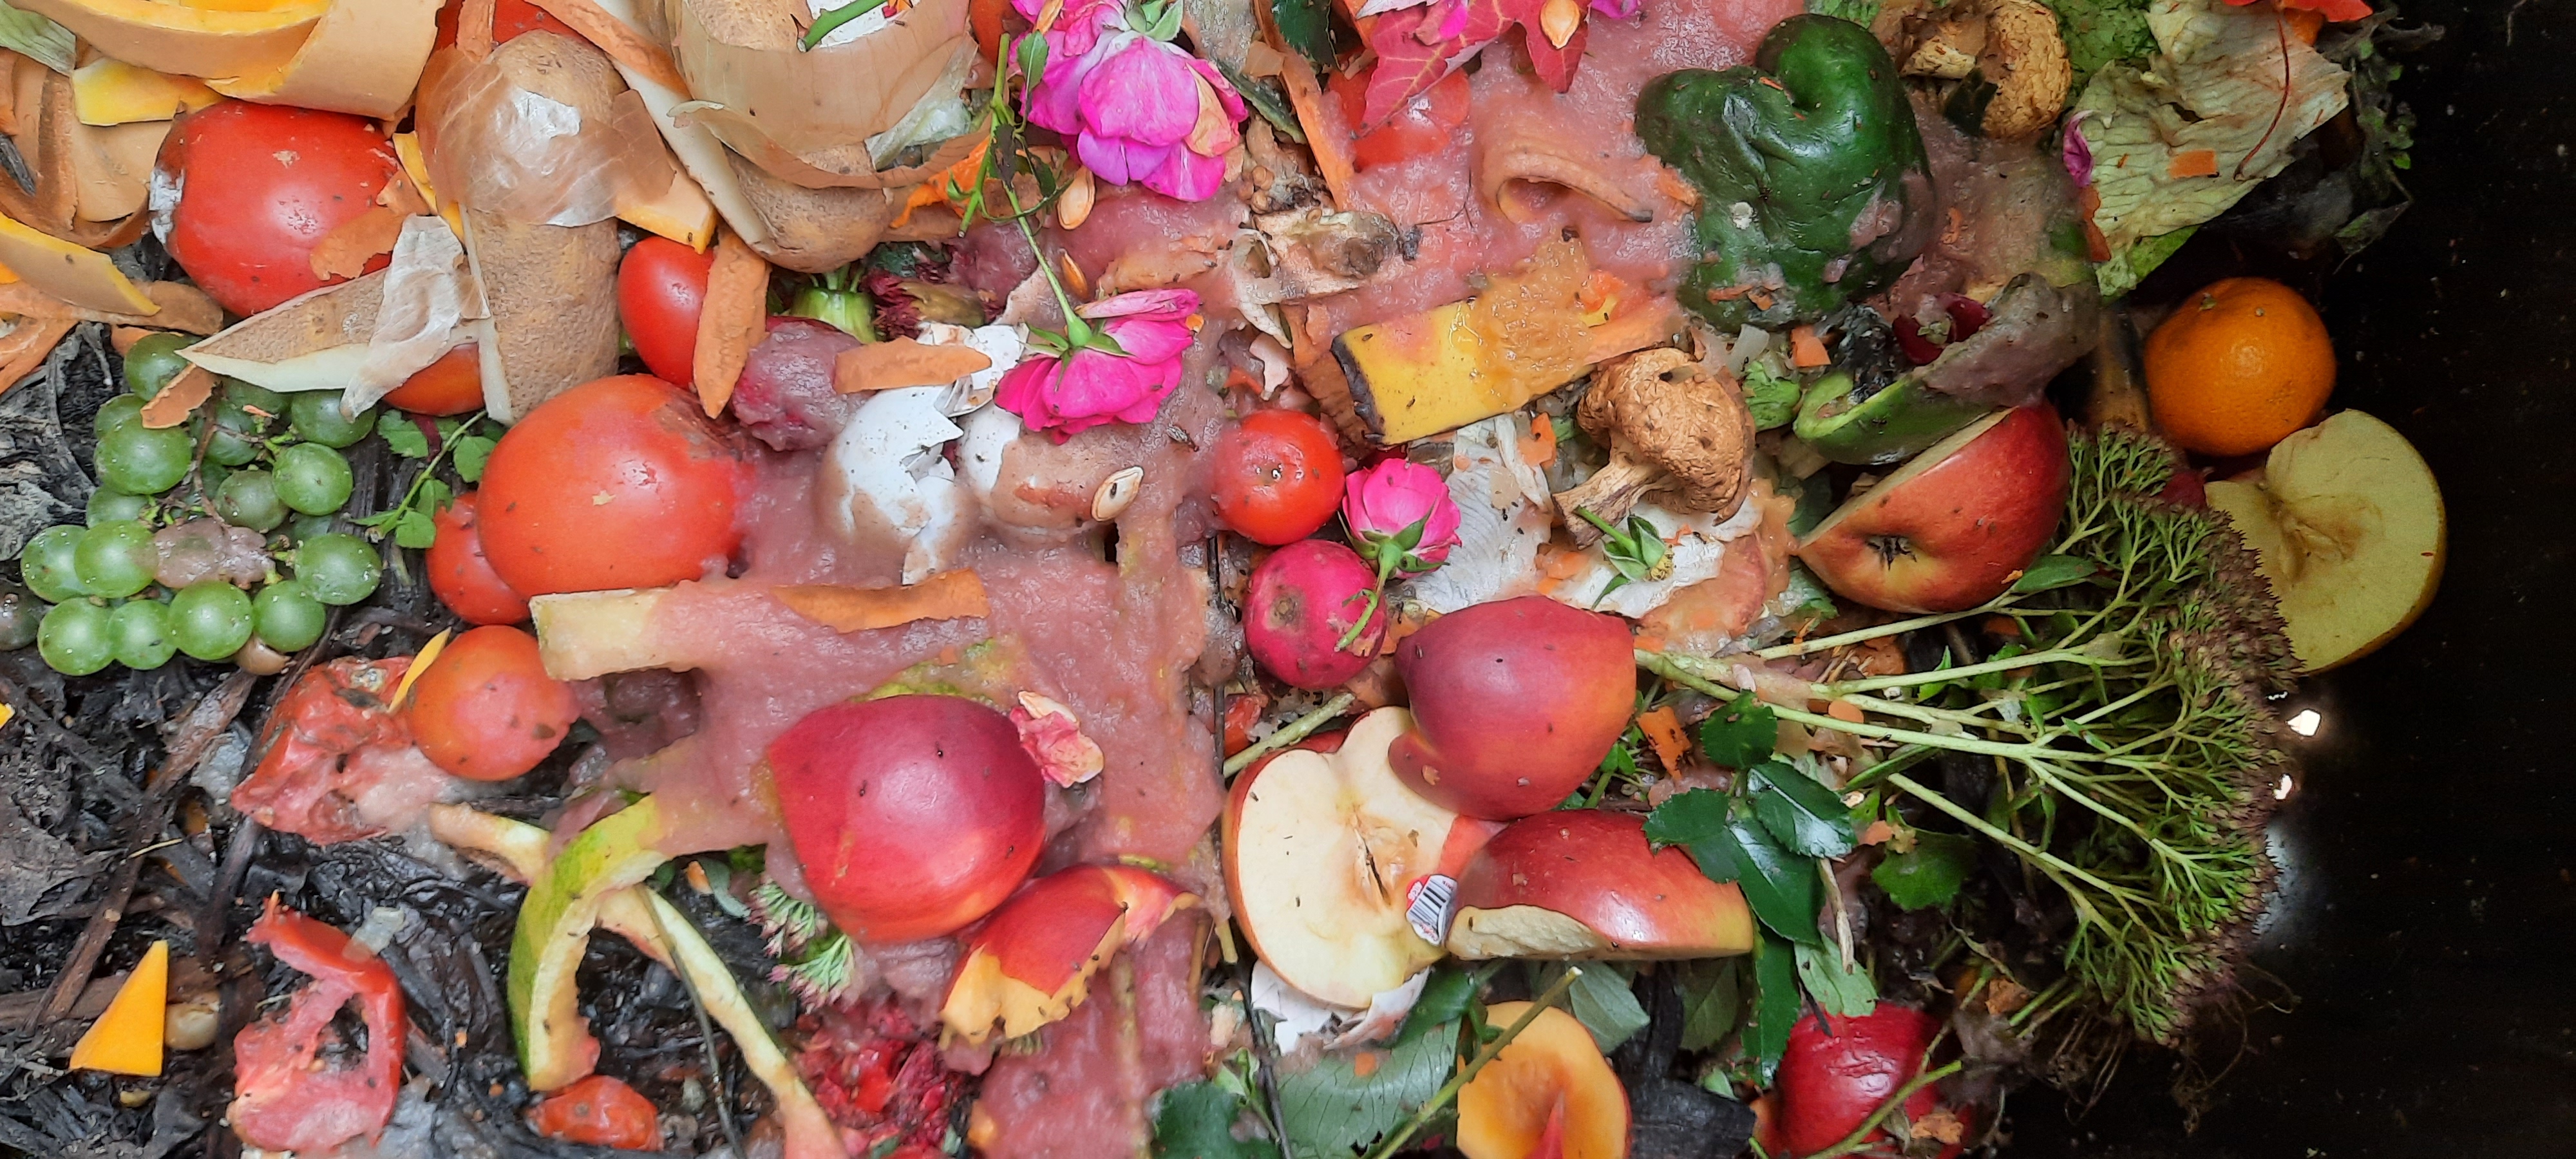
Food wastage has become a hot topic with everyone from the United Nations to numerous NGOs decrying the size of the loss and promoting opportunities to do better. Though I have been critical of some of these reports which usually don’t include any analysis of what a major reduction in food wastage would mean for the entire food system (smaller processing and retail industry sales and employment, as examples), I agree that less wastage would be beneficial in many ways.

There have been some excellent studies. To cite one, Dr. Mike von Massow and colleagues at U Guelph measured the quantity and composition of weekly food wastage for 94 Guelph households that had at least one child. An average of about 3 kg of food per week was found in their household garbage or 230 kg worth an estimated $936 per year. About two-thirds was fruit and vegetables. If an average household had three people, that’s about 80 kg and $312 per person/year. If multiplied by 38 million Canadians, that’s about 3 million tonnes and $12 billion – with almost all of that going to landfills or composting.

The United Nations estimates than 17% of global food is lost or wasted, 14% of that post harvest, and about 11% of the 17% in households. Reference here. If Canadians consume about 26 million tonnes of food per year (reference here), the measurements of wastage by von Massow et al equate (albeit calculated crudely) to about 12% of that – essentially the same percentage as the UN figure.

Though I’ve not provided more references, my impression is that other studies also show food wastage percentages to be in the range of 10-20% with the majority of this being perishable fruits and vegetables.

So it was a real surprise to me when I saw a couple of high-profile reports from University of Guelph researchers in past months stating that Canadians lose or waste about 58% of all food and food ingredients. That includes this recent publication from researchers whom I hold in highest regard.

The 58% figure seemed away too high for me, and inconsistent with the other reports. I decided to dig deeper.

It turns out that it comes from a study done by the consulting company, Value Change Management Inc (VCMI), for Second Harvest, a food bank in Toronto. There are two publications – a shorter summary written by Second Harvest staff – and a 118-page full technical report written by VCMI. Both are accessible here. The following comments pertain mostly to the latter.

Two key tables in the technical report are these (FLW means food loss and wastage, HH means household and HRI means hotels, restaurants and institutions):

2021-09-08 08_50_38-Window

2021-09-08 08_54_50-Window

From Table 3.2 we see that, unlike in the other studies, most of the loss (21.89 million tonnes, or nearly two-thirds of the calculated total 34.89 million tonnes of annual food loss and wastage) involves field crops – mainly grains and oilseeds. It’s not fruits and vegetables as in other studies. And only about 5 million tonnes (2.76 + 2.38), or 15%, is at the consumer level.

Table G enlarges on this, showing that a total of 65% (5% + 8% + 30% + 6% + 5% + 10% +1%) of field crops are loss or wasted in the food chain process.

The technical report is rather vague as to where all these numbers come from. But, it appears that in the case of grain corn that I am most familiar with – they have first taken a crude estimate of the percent of total Canadian grain supply used directly for feed – 60% for corn (also 30% of wheat and 80% of barley) using base figures rounded to the closest 10% provided by this feed industry source. Then they have assumed that all the rest of the corn is used to manufacture food. Hence, they assumed that the difference in weight between the 40% of non-feed corn (adjusted for imports and exports) minus food products produced from corn is all loss or wastage. It’s true as they’ve noted that Statistics Canada does not segregate annual data on corn usage for food and industrial processing, but it seems very incorrect to assume that it’s all (or even mostly) food. And if the same was assumed for usage/processing of all other grains and oilseeds, the error could be huge.

To check further, I had a telephone conversation with two principal researchers at VCMI and it appears that this is only partly right. In the case of soybeans, for example, where about 80% of processed weight ends up as livestock protein feed, they did not assume the 80% is loss or wastage. But in the case of corn, it looks like they did. Other grains are partly in between.

For corn, the 40% for processing produces non-food products like fuel and industrial-grade ethanol, carbon dioxide (which has a surprisingly strong market demand despite greenhouse gas concerns), paper coatings, protein byproduct feeds and more. This is not food loss or wastage.

The authors take some pains to differentiate between planned (or unavoidable) losses and unplanned (or avoidable) losses. See the red columns in Table 3.2. However, this does not really correct for the original flaw. And in the higher-profile material released from this study (see the adjectives like “staggering,” “depressing” and “enormous” used by Second Harvest), it’s the 58% total figure that gets most play.

In summary, I believe that 58% wastage or loss is grossly misleading.

There are three other questionable assumptions in the report that I’ll mention briefly.

  1. In the production of processing crops (good examples being tomatoes and fresh peas in Ontario), it is standard practice to plant more crop than is needed for processing in an average year. This is to ensure that there is still enough crop for processing in years with poor growing conditions – or years when high temperatures mean crops in the field reach and pass the harvestable stage (eg., peas, sweet corn) too quickly for the processing plants to accommodate. Without this allowance for excess in average or better years, there would not be enough crop to meet processor needs in unfavourable years. There are processes in place – for example, crop insurance – to ensure that farmers are compensated financially in years when their crop is ‘bypassed.’

There is, at best, a vague reference to this practice in the technical report. In the summary written by Second Harvest, it states ‘thousands of acres of produce are plowed under due to cancelled orders’ which likely includes this practice. Labelling this as wastage or loss seems misleading as it implies that a societal goal should be its reduction. One could obviously eliminate it if farmers were only to plant enough crop to meet processor needs in better-than-average years. But that would mean plant shut-downs and insufficient food supply in all other years – hardly an appropriate or responsible solution.

  1. The technical report makes an estimate of the value of the food loss or wastage by dividing total value of food produced/marketed in Canada by total tonnes of food. Hence, all wastage and loss is assumed to be worth $4,351 per tonne (the figure is about 10% higher for losses in the HRI sector). That includes agricultural product losses at an early stage of processing and lower-value byproducts like ethanol, paper starch and livestock feed protein. That does not seem realistic.

 Also, the report implies that if this calculated wastage and loss did not occur – meaning that total food supply were    100%/(100% – 58%) or 2.4 times (240%) as large as at present – the value of Canadian food would be 240% higher too. This ignores obvious questions like “Who would eat the additional supply?” It also ignores the basic economics of supply/demand balance.

To the suggestion that it could be mostly sold for export, my response is “At $4351/tonne, I don’t think so.”

  1. My third point seems trivial by comparison, but in the technical report it refers to a 10% loss in onion production attributable to moisture loss during conditioning for storage. However, the same process occurs with several grains including grain corn. Corn dried from about 24% moisture at harvest to 15.5% or lower for storage also endures a weight loss of at least 10%. If the onion calculation was applied to field crops, the calculated Canadian loss and wastage percent would be even higher than 58%.

In summary, I’d recommend that reviewers and others not use 58% as a meaningful estimate of loss and wastage in the Canadian food system. The United Nations figure of 17% seems more appropriate. The 17% loss is still in serious need of reduction, for a world faced with feeding 10 billion by about 2050, but it’s not nearly the 58% calculated in the Second Harvest reports.

A History of the Ontario Corn Producers’ Association, 1982 – 2009

For me, this story starts at a farm meeting at Lindsay Ontario in January 1983. As a University of Guelph-based corn agronomist, I had become convinced Ontario corn farmers had major need for an effective organization to represent them. I had seen what equivalent organizations had accomplished in France, Manitoba and various US states, and wondered, why not the same for Ontario?

Marmora-area farmer Doug Brunton spoke at that farm meeting about fledgling efforts to create just that, and I soon became involved in speaking out in support of the new group at other farm meetings – usually as backup to Dunnville-area farmer, Max Ricker, who chaired the founding committee.

But the story actually begins much earlier. The Ontario Corn Producers’ Association (OCPA) was the culmination of about 40 years of unsuccessful efforts until then to create a marketing board – or marketing board-like organization – to represent Ontario grain corn growers. (More on that history here.)

Details of the initial process leading to OCPA are a bit sketchy, but the process seems to have started with an ad hoc corn marketing committee of the Ontario Federation of Agriculture (OFA) in 1978. The OFA made a formal request to the Ontario Minister of Agriculture and Food for the creation of a marketing board or equivalent in September 1979, supported by a petition signed by 1500 farmers, and another in April 1980, but both requests were denied.

Then in March 1982, another OFA-led committee developed a proposal for a corn association with no marketing board powers but which could administer an Advance Payments for Crops program under the authority of Agriculture Canada, provide information to farmers, and represent them on public issues involving corn. A formal proposal for creation of the Ontario Grain Corn Producers’ Association – later dropping the word, ‘Grain’ – was developed and presented to the Minister of Agriculture and Food, Dennis Timbrell. He supported it and OCPA was created formally on December 29, 1982 with five founding directors, Max Ricker; Doug Brunton; John Cunningham, Thamesville; Seldon Parker, Woodville; and Martin Schneckenberger, Morrisburg.

This achievement was followed by a hectic period of selling individual farmer memberships at $25, election of founding regional directors, and a founding convention on March 28, 29 in Toronto. Doug Brunton was elected first president. The initial OCPA office was with the OFA in Toronto and OFA staff researcher, S. Verraraghavan, was the first secretary. I became unpaid secretary-treasurer in July, replacing ‘Verra,’ though I was still employed full-time in the Department of Crop Science, University of Guelph.

In September 1983, OCPA leased an office and hired its first two paid employees, Judy Sweeney as office manager and Don LeDrew as program coordinator. Don was hired initially to develop and run an Advance Payment for Crops program for grain corn (interest-free money loaned to farmers at harvest time, to be repaid when the corn is later sold or fed; loans guaranteed by Agriculture Canada – later Agriculture and AgriFood Canada). Don quickly assumed other management responsibilities.

Terry switched formally to a one-quarter-paid time with OCPA in mid 1984 and then full-time with OCPA in January 1985 with various position titles including that of executive vice president.

OCPA was initially funded by annual memberships of $25 plus lots of volunteer effort. But Minister Timbrell announced at the OCPA annual meeting in March 1984 his intention to introduce check-off funding for the 1984/85 grain corn marketing year and an interim grant of $60,000 to cover some costs in the interim. The Grain Corn Marketing Act was introduced in the Ontario Legislature and approved in three readings, all on the last legislative sitting day of June 1984. OCPA had good political support from all three Parties in the Legislature. A mandatory-but-refundable-upon-request checkoff of 10 cents per tonne of corn sold to commercial corn buyers was initiated on October 1, 1984. There was no producer vote, which led to initial concerns that the request-for-refund ratio would be large. But to my knowledge, it never got as high as 1%.

The early-to-mid 1980s were a very difficult time for North American corn farmers, the result of plunging grain prices and extremely high rates of interest on borrowed money – all made worse by a preceding decade of mostly high grain prices, high inflation and interest rates often below rate of annual inflation. This combination had encouraged farmers to increase their debit obligations to finance expansion – making the financial blood bath to follow that much more severe.

From the beginning OCPA was focused on grain farm income. An early achievement involved finding an error in a federal calculation of whether Ontario corn farmers were eligible for a federal grain stabilization payout on sales in 1982/83 marketing year sales. The resulting corrective payment of $4.48/tonne went a long way in establishing the credibility of OCPA among corn growers.

The insolvency of Niagara Grain and Feed of Smithville in autumn 1983 led to a major campaign by OCPA that resulted in affected farmers recovering almost all of their lost funds for corn deliveries and sales to the elevator. That exercise led directly to the creation of the Ontario Grain Financial Protection program – a combination of buyer licensing for financial reliability and the building of a compensation fund using a checkoff on commercial grain sales. This program continues to work well in Ontario.

OCPA played a major role in the creation of two ‘Special Canadian Grains Programs’ in 1986 and 1987 to compensate Canadian grain farmers for a portion of financial losses experienced as the result of a then-intense international subsidy and trade wars. OCPA also initiated a successful corn countervailing duty trade action on Canadian imports of most forms of grain corn from the US from 1986 through 1991, which both boosted corn farm income in years when Canada was a net corn importer, and also highlighted the injurious nature of US grain subsidy programs at the time. The Canadian countervailing duty was very effective in reducing the damage to Canadian corn growers for five years. When it was eliminated by a World Trade Organization decision in 1991, the rationale for its existence had diminished substantially.

Likely because of this experience, OCPA became an active member of advisory committees to the Government of Canada during the development of the Canada-US Trade Agreement, then NAFTA (North American Free Trade Agreement – including Mexico) and then the Uruguay Round of the World Trade Organization negotiations.

Crop insurance reform was another early priority for OCPA. The organization playing a major role in reforms that led to better coverage and, especially the ‘floating price option’ that meant that farmers were compensated at close to harvest market price when they lost crops because of insurable weather perils. This was of major benefit in encouraging pre-harvest corn delivery contracts.

OCPA played a major role in the creation of several successive national grain farmer income protection programs that followed in the two decades after 1990.

In addition to farm income support/protection, OCPA was very active on other fronts:

A meeting of Ontario farm groups chaired by OCPA in 1986 led to the creation of what became AGCare (Agricultural Groups Concerned about Resources and the Environment) with leadership provided on safe pesticide usage and the establishment of Environmental Farm Plans in Ontario. A formal request from AGCare led to the establishment of Ontario’s Ontario Pesticide Education Program with its mandatory training and certification of farmers for pesticide usage. AGCare and OCPA played major roles in the early approval of genetically enhanced crops for use in Canada. OCPA lobbied aggressively for early Canadian approval of usage of genetically enhanced ‘Bt’ corn hybrids.

AGCare was headquartered in the OCPA office, with OCPA providing free rental and secretarial service for a number of years. AGCare later became part of Farm and Food Care Ontario.

OCPA played a major role in government approvals for and industry development of a biofuel industry in Canada. Terry Daynard served as an early president of the Canadian Renewable Fuels Association, to be succeeded in that position in 1989 by Lambton County farmer, Jim Johnson (also an early OCPA president).

OCPA was driven by a marketing philosophy that, while Canadian corn exports were important, more important were opportunities to increase the usage of home-grown crops to manufacture new food and industrial products. This led to strong organizational interest in other bioproducts such as bioplastics, and in support for domestic corn processors who produced feedstocks for those innovative companies.

OCPA was also active in communications. A monthly newsletter to members was one of its earliest contributions and this led to a partnership agreement with Cash Crop Publications in Delhi, Ontario and the transformation of its former monthly Cash Crop Farming into the Ontario Corn Producer magazine (now known as the Ontario Grain Farmer magazine).

OCPA was one of the first Canadian agricultural organizations or businesses to use a fax machine (in 1986 or 1987) and this followed by purchases of fax machines for all directors. I well remember the discussions with other farm groups attempting to persuade them to also “get faxes” so we could send paper copies of material to them immediately rather than by day, or multi-day, courier service as was the norm at the time.

The same happened with email and Internet. OCPA and its directors all made this transition in the early 1990s and the OCPA web site won early Canadian national recognition (about 1995) for its innovative approaches.

OCPA was one of the earliest farm groups to hire a full time communications coordinator with his time being spent mostly on ag awareness activities as well as promotion of OCPA objectives such as biofuels.

OCPA was an active supporter of farm coalitions playing major roles in the early creation of the Ontario Agricultural Commodity Council (actually a transformation from an earlier OFA committee), the Agricultural Adaptation Council, ACC Farmers Financial, the Grain Growers of Canada, the Ontario Field Crops Research Coalition and others. These activities were largely the result of initiatives of OCPA directors and delegates, with support by OCPA staff.

I left OCPA in early 2002 and am not as familiar with association activities from then until formal amalgamation eight years later with Ontario soybean and wheat groups to form the Grain Farmers of Ontario. That transition occurred over several years with the three groups sharing a common office location but separate organizations at 100 Stone Road West, Guelph from 2005 to 2010. OCPA continued to be very active on farm income support programs and championed another (this time unsuccessful) trade action against imported US corn. OCPA was part of the coalition of farm groups responsible for creating, in 2007, the Risk Management Program currently used for farm income support in Ontario.

OCPA offices beginning in September 1983 were at 292 Speedvale Avenue West, then 190 Nicklin Road (September 1986), then 90 Woodlawn Road West (September 1991) and then 100 Stone Road West (September 2005). Formal amalgamation of the three groups, and the end of the Ontario Corn Producers’ Association, occurred on January 1, 2010.

Presidents of OCPA were:

Max Ricker, Dunnville, chair of founding committee

Doug Brunton, Marmora, 1983-1984

Ed Kalita, Eagle, 1984-1987

Cliff Leach, Paris, 1987-1990

Frank Anthony, Limehouse, 1990-1993

Jim Johnson, Alvinston, 1993-1996

Bob Down, Exeter, 1996-1999

Anna Bragg, Bowmanville, 1999-2001

Dennis Jack, Thamesville, 2001-2003

Matt Menich, Vanessa, 2003-2005

Doug Eadie, Ripley, 2005-2007

Dale Mountjoy, Oshawa, 2007-2009

A special thank you to Brenda Miller-Sanford, member of the staff of both OCPA and the Grain Farmers of Ontario, for her help in assembling information used in this column.