
The world, unfortunately, is full of distorted information about climate change and the value and effectiveness of corrective actions being undertaken in response. The confusion includes reports on how well Canada and Canadian agriculture are doing relative to international commitments, and compared to other countries.
This article provides a summary of what I’ve learned in reviewing data that Canada and other developed nations submitted to the United Nations Framework Convention on Climate Change (UNFCCC) in April 2020. The data are for the year 2018 and previous years going back to 1990.
I’ve written this article for the benefit of those with interests in agriculture, climate change and greenhouse gas (GHG) emissions but who lack the time to review the topic in any detail. I’ve tried my best to write without any praise or condemnations in providing a layman’s summary of what the data say. At the end, I’ll provide links to more extensive information.
My conclusions can be summarized in a few bullet-points. However, please read the whole article to understand the basis for the statements, including supporting data.
- As of 2018, Canada had made essentially no progress in meeting its Paris Accord commitment for a 30% reduction in GHG emissions over the interval 2005 to 2030. Indeed, it has generally fared less well than other developed countries for which I’ve checked the data, including the United States.
- There was essentially no change in net GHG emissions from Canadian agriculture over the period 2005 to 2018, at least with the reporting protocol used by UNFCCC. That conclusion holds whether carbon sequestration in agricultural soils is included or not. However, Canada appears to be no different in this regard than other developed countries.
- The UNFCCC reporting section for agriculture is dominated by emissions associated with livestock agriculture (ruminant methane and manure storage) and the application of nitrogen fertilizers, lime and other amendments to soil. These emissions are mostly methane (CH4) and nitrous oxide (N2O). To these gross emission numbers reported in the Agriculture section of national reports to UNFCCC, one can add net emissions (positive or negative, and mostly CO2) from cropland soils. The latter are summarized in another section of the National Inventory Reports called Land Use, Land-Use Changes and Forestry (LULUCF).
- Unfortunately, the summation exercise is more difficult for data on emissions caused by on-farm fossil energy combustion and the reduction in national GHG emissions caused by use of biofuels made from agricultural feedstocks. I’ve done this calculation for Canada but it proved to be essentially impossible for me to do this in a consistent way for other countries. The inclusion of fossil fuel usage increases the calculated GHG emissions for agriculture in Canada. However, inclusion of biofuel data means about a 10% decrease in 2018 Canadian agricultural net emissions. That percentage increased substantially after 2005. When you add all numbers together – reported ‘agricultural’ emissions, LULUCF for cropland, farm fossil fuel usage and biofuels – the resulting sum for Canadian agriculture is identical for 2005 and 2018.
- The UNFCCC reporting protocol has been heavily criticized by agricultural scientists and others for two major reasons: i) lack of recognition of the fact that methane has a much shorter existence (half-life) in atmosphere than other major GHG, and ii) the accounting does not recognize the carbon stored in food and other agricultural products. Both of these will affect any analysis of the effect of changes in agricultural practices on climate change. However, unless or until the calculation protocol is changed, agriculture will likely be judged in most GHG discussions on the data now reported to UNFCCC.
Canada was one of the countries that created the United Nations Framework Convention on Climate Change (UNFCCC) in 1992 with attendant commitments to provide an annual accounting of national human-made greenhouse gas (GHG) emissions. Canada has been a party to international agreements made since then to reduce net emissions by certain percentages by specified dates. Although the Government of Canada renounced its initial commitment for reductions under the Kyoto Protocol, it is part of the more recent Paris Accord, committing Canada and other countries to reduce net emissions by 30% by year 2030 compared to base year 2005. Details on the Canadian commitment are here.
Fossil hydrocarbon combustion is recognized universally as the dominant source of anthropogenic (human-made) GHG emissions. However, agriculture is also a significant GHG source globally, according to data submitted to UNFCCC using reporting protocols specified by the International Panel on Climate Change (IPCC).
Agriculture has come under intense criticism at times because of this fact.
Claims about agricultural contributions have been often exaggerated by those who oppose the inherent structure of modern agriculture – and are eager to use GHG emissions to further their individual causes. Agricultural organizations, in turn, have emphasized the critical need for food production in sufficient quantities and at an affordable cost of production to feed a world population approaching 10 billion people. Proponents of various types of agriculture have been eager to show (often using carefully selected data, and often in disagreement with each other) that their type of agriculture is superior to others from a GHG-emission perspective.
In April 2020, the Government of Canada, like many other countries, submitted its annual National Inventory Report (NIR) on greenhouse gas (GHG) emissions and sinks to the United Nations Framework Convention on Climate Change UNFCCC). These reports are for emissions in calendar year 2018 and can be accessed here. Scroll down to the specific country, then click on “NIR.” More basic data for each country are available in Excel spread-sheet format, labelled “CRF,” at the same site.
I posted a Twitter thread soon after the April release, summarizing a few highlights with a focus on Canadian agriculture, while promising a more detailed analysis to follow. Hence this article.
First a quick explanation: The UNFCCC reporting protocol is designed for simplicity in reporting (not that it’s very simple) and, for the most part, does not provide comprehensive summarization by economic or cultural sectors. That can cause confusion, as discussed below. The Government of Canada does provide a modest economic sectoral summation in its report though, in the case of agriculture, the Canadian summary actually adds confusion.
I’ve provided my own summations below.
Remember that the reports to UNFCCC only go to the end of 2018, well before COVID- linked effects of 2020 were evident.
Canadian achievements in reducing new GHG emissions compared to Paris Accord commitments
A summary of total Canadian gross emissions is shown in Table ES-1 (copied below from the Canadian National Inventory Report, NIR). Values are expressed in Mt (million tonnes) of CO2 equivalent, recognizing that other greenhouse gases have different atmospheric heating effects compared to carbon dioxide (CO2). As the table shows, by 2018, about half way through the 2005-2030 timeframe, Canada had made virtually no progress towards meeting its Paris Accord commitment. A 3% reduction occurred from 2005 to 2016, but during the last two reporting years, that trend was reversed.
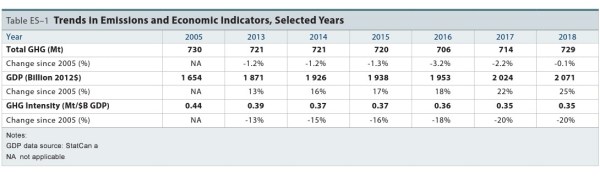 Without going into details that lie beyond the intended scope of this article, decreases in the energy used to produce electricity in Canada since 2005 have been countered by increases in energy used for road transportation and for oil and gas extraction – with most other GHG-producing sectors showing little change over the 13-year interval.
Authors of the Canadian NIR attempt to counter the weak Canadian record by emphasizing a reduction in GHG emissions relative to GDP (see table above and graph ES-1 below). But the Paris Accord is about absolute reductions, not reductions compared to GDP.

Neither the table nor graph shown above include values for a category called, Land Use, Land Use Changes and Forestry (LULUCF), which is essentially net CO2 conversion into soil organic matter and tree biomass. More on that below. However, the inclusion of LULUCF values in Table ES-1 would not change the overall conclusion; the LULUCF for Canada was only -13 Mt of CO2 equivalent (a net sink) in both 2005 and 2018.
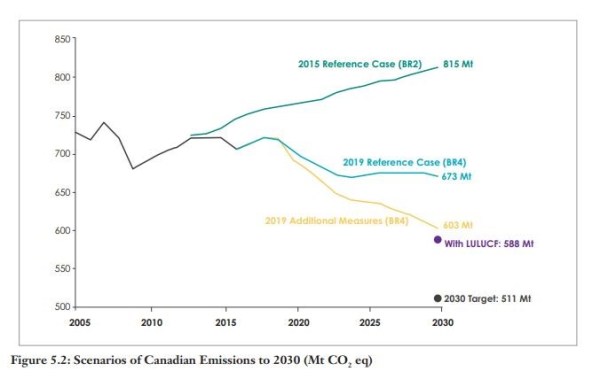
Although Canada made no progress in meeting its Paris Accord commitments by 2018, the Government of Canada says it has a plan to meet the full 30% reduction (i.e. from 730 Mt CO2 equivalent in 2005 down to 511 Mt) by 2030. The plan is included in this December 2019 report to UNFCCC and key values are graphed below. In the graph, “2019 Reference Case” refers to measures the government says are well advanced, and “2019 Additional Measures” means ones in in various stages of development or consideration. Interestingly, the Government of Canada appears to include LULUCF offsets in its anticipated target for 2030, but not in the base value for 2005.
The conclusion from Figure 5.2 (below) seems clear. The Canadian ‘plan’ for reductions by 2030 is for a total reduction of only 19% (18% if you include LULUCF in both 2050 and 2030). A recent pledge by the Canadian Prime Minister that Canada will achieve 100% reduction by 2050 seems, at this stage, to be only a pipe-dream.
Canadian Agriculture
For Canadian agriculture, NIR Table S-1 shows that total emissions increased prior to 2005 but have been essentially stable in years since. Note that the GHG values shown in Table S-1 are in thousands of tonnes of CO2 equivalent. Most of the agricultural emissions reported in NIR are in the form of CH4 from ruminant livestock, CH4 and N2O from manure management, and N2O release from soil with organic and synthetic fertilizer nitrogen application and from organic matter decomposition in the field. There is a moderate amount of CO2 released from the application of lime and urea to farm soils.

The table for agriculture shown above does not include any credit for CO2 sequestration stored as soil organic matter (data are reported separately in the LULUCF chapter of the NIR), nor of CO2 emissions from on-farm fossil fuel combustion. Nor does it include any credit to agriculture for the use of biofuels made from agricultural feedstocks. Also missing are CO2 emissions caused by crop input manufacture (eg., N fertilizers).
Because of that, I have used data appearing elsewhere in the NIR report to make my own summations.
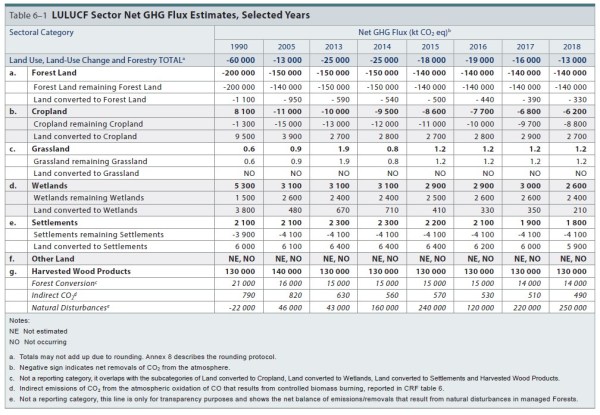
First, let’s look at NIR statistics on LULUCF (carbon sequestration) linked to agriculture. Table 6-1, shown below, is more complex than needed for my purpose as it shows all LULUCF values for Canada including the largest one, forestry. Note that conversion of CO2 into sinks means negative values, and soil/forest organic matter conversion to CO2 means positive values. The main values in the table relevant to Canadian agriculture are those for cropland; there are three sets of numbers – one for forest and grassland converted into cropland, one for cropland conversion to forest, and one for changes in management practices for cropland that remains cropland.
More details on the changes in cropland management practices as they affect C sequestration in cropland soils are shown in Table 6-9.
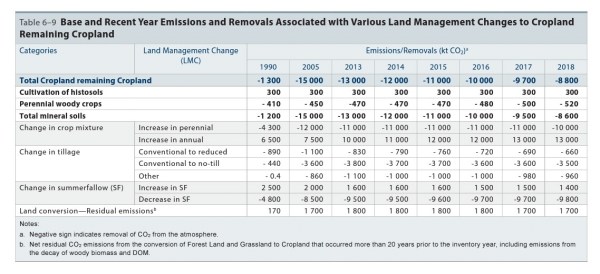
GHG sink credits are reported for converting cropland from annual crop production into perennials (and the reverse for perennials to annual crops), for adopting reduced/no tillage, and for cropland conversion from summer fallow. The assumed annual sink credit from conversion to perennial crops and reduced/no tillage diminishes gradually from a maximum value to zero over a number of years.
Histosols are organic soils.
The size of the annual agricultural soil sink for CO2 increased during the 15 years prior to 2005, to -11 Mt CO2, but this trend has reversed in years since – mainly because of conversion of perennial crop hectares into annual crop production. The LULUCF for Canadian agriculture in 2018 was -6.5 Mt CO2 (from Table 6-1).
The UNFCCC NIR protocol does not require countries to include, in their reporting, CO2 emissions associated with the sustainable use of biofuels, which Canada has assumed to mean all fuel ethanol and biodiesel used in transportation. The stats for biofuel consumption are reported in millions of litres in the following two NIR tables. Although the NIR does not show the equivalent CO2 values, it does list the conversion factors needed to make the calculations. I’ve shown the result of those calculations in the third table below.


| Canadian Biofuel Consumption | 2005 | 2018 |
| Mt CO2 equivalent | ||
| Ethanol | 0.4 | 3.9 |
| Bio-diesel | 0.0 | 2.2 |
| Sum | 0.4 | 6.1 |
The 6.1 Mt CO2 shown above for Canada in 2018 is effectively a credit to the energy sector in that CO2 emissions from biofuel combustion are not included in UNFCCC GHG sums for Canada. If this was an agricultural credit, it would reduce net agricultural emissions by about 10% (see calculations below).
On the subject of fuels, the NIR does not directly show statistics for on-fuel fossil fuel usage in agriculture, but the numbers can be calculated from values in other tables. On-farm fossil fuel usage declined from 15 Mt CO2 equivalent in 2005 to 14 Mt in 2018.
As for the manufacturing of inputs used in agriculture, this calculation is both very difficult and speculative, based on various assumptions and limited data, and the result is not likely to change the overall pattern of change in Canadian agricultural GHG emissions between 2005 and 2018 or by 2030. Also, these calculations are not required in UNFCCC reporting protocols.
One quantity of interest might be GHG emissions with the manufacture of ammonia to make farm fertilizers. Unfortunately, the NIR does not provide statistics on the portion of Canadian ammonia production used for fertilizer manufacture, but does note that most of the CO2 released in making ammonia is reabsorbed during the subsequent manufacture of urea. Hence, I’ve not included an estimate of GHG balances associated with fertilizer manufacture. Even if included, it would be highly unlikely to have affected the pattern of annual changes reported after 2005.
So, by using the numbers sourced or calculated above, I’ve made a summary of all identified emissions and sinks for Canadian agriculture, for years 2005 and 2018. See the following table, with all values rounded to the closest Mt of CO2 equivalent.
Table 1: Canadian agricultural GHG emissions including credits and debits for LULUCF, on-farm fuel usage and Canadian biofuel consumption.
| 2005 | 2018 | 2018/2005 | % of Cdn total | ||
| Mt CO2 equivalent | % | (2018) | |||
| Total Canadian gross emissions | 730 | 729 | 100 | 100 | |
| LULUCF (sinks), Canadian total | -13 | -13 | 100 | ||
| Canadian total, gross emissions plus LULUCF | 717 | 716 | 100 | ||
| Agriculture | |||||
| Ruminant digestion, CH4 | 31 | 24 | |||
| Manure management, CH4 and N2O | 9 | 8 | |||
| N2O from soil fertilizing, management | 19 | 25 | |||
| Other | 1 | 3 | |||
| Agriculture total, reported to UNFCCC | 60 | 59 | 98 | 8.1 | |
| Add LULUCF credit | -10 | -6 | |||
| Agricultural total with LULUCF added | 50 | 53 | 106 | 7.4 | |
| Add biofuel credit | -1 | -6 | |||
| Add on-farm fossil fuel usage | 12 | 14 | |||
| Total, biofuel and farm fuel included | 61 | 61 | 100 | 8.5 | |
(Note that agricultural values for 2005 in Table 1 have been corrected from the erroneous ones shown in an earlier version of this blog.)
When all the add-ons and credits are included, the pattern is about the same as that reported by Canada to UNFCCC in April 2020. Agriculture represents about 8 percent of Canadian GHG emissions (gross or net) – a percentage that has not changed much since 2005. Increases in emissions are mostly owing to increased use of nitrogen fertilizer and fewer perennial crop hectares. The biggest decline since 2005 involves methane emitted by beef cattle. (Perhaps that’s also why perennial crop hectares declined.)
To my knowledge, the Canadian NIR contains no tables showing these sums, even including the addition of LULUCF agricultural credits from agricultural emissions. However, there is one exception: the Canadian NIR contains a prominent table in the Executive Summary called GHG Emissions Economic by Sector, where it adds on-farm fossil fuel usage to the agricultural total reported to UNFCCC, but with none of the credits included. That table is shown below. This has the effect of increasing Canadian agricultural contribution to 10% of the Canadian total, versus 8.5% if credits are included too.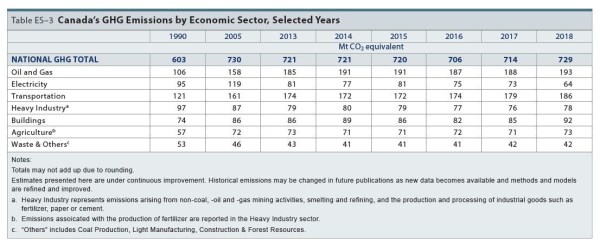
I have no idea why Environment and Climate Change Canada, which prepares the Canadian submissions, did this. It was not required by UNFCCC, and I don’t see it in NIRs from other countries.
How Canadian figures compare to those for other countries.
One way to put the Canadian numbers in perspective is to compare them with those from other countries. I’ve completed the following table using CRF (Common Reporting Framework) data (source here) reported by the United States, the United Kingdom, France, The Netherlands, Sweden and Australia.
I would have loved to include comparisons with Brazil, India and China, as three lesser-developed countries with large agriculture, but the data are not available from this UNFCCC source.
(For those wanting to know specifics, I’ve used the CRF Tables 4, 4A, 4B, 4C and Summary1.As2 for years 2005 and 2018 as the sources of data. These tables are quite consistent in format across countries though there are differences in the manner and extent to which CH4 and N2O emissions from agricultural soils are included in calculating LULUCF balances. Also, because of differences in the extent to which different countries consider grasslands as agriculture, I’ve restricted my accounting to cropland in the CRF tables.)
I found it impossible to find equivalent data for most countries on fuel usage in agriculture or offsets from biofuels/bioenergy so those comparisons are not provided.
Negative LULUCF sums denote net sinks; positive LULUCF values denote net sources.
Table 2: Comparisons from several developed countries of gross and net agricultural GHG emissions.
| Country | 2005 | 2018 | 2018/
2005 |
|
| Canada | Mt CO2 equivalent | % | ||
| National gross GHG emissions | 730 | 729 | 100 | |
| National LULUCF | -13 | -13 | ||
| National emissions plus LULUCF | 717 | 716 | 100 | |
| Agriculture gross emissions (% national) | 60 (8.2) | 59 (8.1) | 104 | |
| Agricultural LULUCF | -10 | -6 | ||
| Agriculture plus LULUCF (% national) | 50 (7.0) | 53 (7.4) | 106 | |
| USA | National gross GHG emissions | 7390 | 6680 | 90 |
| National LULUCF | -815 | -774 | ||
| National emissions plus LULUCF | 6580 | 5900 | 90 | |
| Agriculture gross emissions (% national) | 576 (7.8) | 618 (9.3) | 107 | |
| Agricultural LULUCF | -43 | -24 | ||
| Agriculture plus LULUCF (% national) | 533 (8.1) | 594 (10.1) | 111 | |
| UK | National gross GHG emissions | 688 | 456 | 66 |
| National LULUCF | 7 | 10 | ||
| National emissions plus LULUCF | 695 | 466 | 67 | |
| Agriculture gross emissions (% national) | 44 (6.4) | 41 (9.0) | 93 | |
| Agricultural LULUCF | 9 | 7 | ||
| Agriculture plus LULUCF (% national) | 53 (7.6) | 48 (10.3) | 91 | |
| France | National gross GHG emissions | 555 | 445 | 80 |
| National LULUCF | -45 | -26 | ||
| National emissions plus LULUCF | 510 | 419 | 82 | |
| Agriculture gross emissions (% national) | 77 (13.9) | 75 (16.9) | 97 | |
| Agricultural LULUCF | 21 | 20 | ||
| Agriculture plus LULUCF (% national) | 98 (19.2) | 95 (22.7) | 97 | |
| Netherlands | National gross GHG emissions | 215 | 188 | 87 |
| National LULUCF | 6 | 5 | ||
| National emissions plus LULUCF | 221 | 193 | 87 | |
| Agriculture gross emissions (% national) | 18.4 (8.6) | 18.2 (9.7) | 99 | |
| Agricultural LULUCF | 1.7 | 1.6 | ||
| Agriculture plus LULUCF (% national) | 20.1 (9.1) | 19.8 (10.3) | 99 | |
| Sweden | National gross GHG emissions | 63 | 52 | 83 |
| National LULUCF | -34 | -42 | ||
| National emissions plus LULUCF | 29 | 10 | 34 | |
| Agriculture gross emissions (% national) | 7.0(11.1) | 6.8 (13.1) | 97 | |
| Agricultural LULUCF | 3.9 | 3.8 | ||
| Agriculture plus LULUCF (% national) | 10.9 (37.6) | 10.6 (106) | 97 | |
| Australia | National gross GHG emissions | 526 | 588 | 112 |
| National LULUCF | 91 | -21 | ||
| National emissions plus LULUCF | 617 | 567 | 95 | |
| Agriculture gross emissions (% national) | 80 (15.2) | 76 (12.9) | 95 | |
| Agricultural LULUCF | 7 | -2 | ||
| Agriculture plus LULUCF (% national) | 87 (14.1) | 74 (13.1) | 85 | |
Some conclusions:
- In contrast to Canada, the other selected countries have generally achieved notable reductions in national GHG emissions since 2005, either with or without the inclusion of LULUCF data (true for Australia only with LULUCF included).
- In general, agriculture represents about 7-15% of total national GHG emission, including or not including LULUCF data. Two exceptions are France, where the agricultural percentages are higher, and Sweden, where national calculations with LULUCF included are dominated by a huge national C sequestration in forests.
- With the exception of the United Kingdom and Australia, GHG emissions from agriculture have not declined since 2005. This applies whether LULUCF data are included or not. (The UK numbers reflect a significant reduction in numbers of ruminant animals.)
- As a percent of national GHG emissions, the agricultural portion increased in every country except Australia between 2005 and 2018.
- In the European countries included in this small survey, agricultural soils are a net source rather than sink for carbon dioxide. This stands in contrast to a stated objectives in some countries – notably France – to increase the national carbon content in soils by 4 per 1000 per year (reference here) as part of GHG reduction strategies.
Further Plans
My next goal is to examine various plans that have been developed by governments, farm groups and others to reduce net emissions from agriculture. I also want to look at the extent to which IPCC calculation procedures for methane, and lack of consideration for the carbon content in agricultural products, affect calculations of agricultural net emission calculations. I expect the effects of both to be substantial.
But those reports will await another blog.
References
Source of National Inventory Reports (NIR) and Common Reporting Format (CRF) data on Greenhouse Gas Emissions, Sources and Sinks, submitted to the United Nations Framework Convention on Climate Change (UNFCCC). 2020. https://unfccc.int/ghg-inventories-annex-i-parties/2020
Canada’s Fourth Biennial Report on Climate Change. 2019. https://www4.unfccc.int/sites/SubmissionsStaging/NationalReports/Documents/1687459_Canada-BR4-1-Canada%E2%80%99s%20Fourth%20Biennial%20Report%20on%20Climate%20Change%202019.pdf
Column updated August 30, 2020.

7 Comments