How and When Corn Came to Canada, and How it was Grown

Champlain’s Missed Rendezvous

2018-10-0021.jpg

It’s one of the most significant missed rendezvous in Canadian history – and one of the grandest journeys. Samuel de Champlain, explorer and champion of a fledgling French Canada, had been late for a gathering of native leaders near what was to become Montreal in the spring of 1615. He rushed to catch up with them using two canoes and 10 skilled, mostly indigenous, canoers. They paddled and portaged up the Ottawa River, across Lake Nippissing and down the French River to Georgian Bay – then down the length of its rocky eastern shore with its 30,000 granite islands and wind-blown, scraggy jack-pine trees. After 800 kilometers in 23 days, they arrived suddenly at what must have seemed like an Eden – good farmland and corn farmers in what’s now called Huronia in northern Simcoe County.

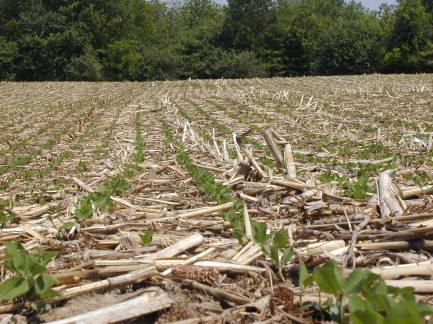
That transition in geography is just as unique today as it was then – as anyone who drives south on Ontario Highway 400 from Port Severn into Simcoe County – from a Precambrian landscape to quality farmland – can attest.

This would not have been Champlain’s first encounter with corn farming. Some indigenous farming was done on modest scale by nations along the Ottawa River through which he had travelled. He likely saw corn fields during his historically significant trip to Lake Champlain country in 1609 where he and his companions encountered and shot several Mohawk warriors. But the scale and grandeur of farming in Huronia would still have been a huge surprise.

(After reaching Huronia, Champlain became part of a large group of Huron and Algonkian nation warriors who attacked an Onondaga town near what’s now Syracuse, New York – a raid which was actually the reason for the missed appointment in Montreal and a fascinating story in itself – but I won’t enlarge here. You can read about it all in the classic, Champlain’s Dream, by D. H. Fischer)

Champlain spent that autumn and winter in Huronia visiting about 20 Huron and Petun towns/villages, who collectively called themselves, ‘Wendat.’ His detailed records of what he saw constitute much of what we know about this remarkable farming society during the mostly pre-European-contact era (“mostly” because some European goods were present in interior indigenous communities decades before the arrival of the first European explorers, thanks to well-developed indigenous trade networks).

Champlain estimated that the Huron confederacy numbered about 30,000 people, including towns as large as 5000 residents. When combined with an estimated 15,000 Petun people living just a few km to the west, this represents a Wendat population about as large as what exists in northern Simcoe County today.

These communities were all based on the growing of corn – huge quantities of corn in huge fields. Champlain reported seeing fields as large as 1000 acres and Gabriel Sagard, who wrote about Huronia 15 years later, said, “[The large fields were] the reason why going alone sometimes from one village to another I usually lost my way in these cornfields, more than in the prairies and forest.” The Wendat grew corn in quantities sufficient to produce food reserves for two or more years and also for trade with neighbouring non-farming Algonkian nations – trading for furs and materials such as copper from near Lake Superior. The Wendat did grow plants other than corn (primarily beans, squash, sunflower and tobacco) and their meals sometimes contained meat and fish, but their diet was dominated by corn.

I’ll come back to Huronia later, but first I want to shift back to an era 600 years or more earlier.

The Beginnings

2018-10-0026

Most readers will know about the transition of wild teosinte into corn (or maize) in Mexico about 5000 BC. From this beginning, corn culture moved slowly northward, entering the southwestern United States in about 2000 BC. It became the basic food for several native societies that flourished in New Mexico, Arizona and adjacent states up until about 1000 AD.

From the southwestern United States and/or northeastern Mexico, corn worked its way north and east, and especially along the Mississippi River system, where it flourished sometime after 800 AD. The largest example of a Mississippian, corn-based civilization is the former city of Cahokia in Illinois, near St. Louis. It peaked from about 1000 to 1400 AD and likely had a population in excess of 25,000 people. Cahokia was the largest city north of Mexico at the time – indeed, matching or exceeding some major European cities in size. This was a city and civilization based on corn, but supplemented with some other food crops.

There were many other smaller but significant corn-based communities elsewhere along the Mississippi-Missouri-Ohio river system. Corn culture spread up the Ohio River valley – then via the Alleghany River into the present New York State – and from there a few kilometers north into the present-day Ontario.

Estimates as to when corn entered Ontario vary. Some say as early as 500 AD. Georges Sioui, in his book Huron Wendat, The Heritage of the Circle, refers to a radiocarbon dating to 615 AD of corn residue found near Rice Lake Ontario. A summary by the Ontario Archaeological Society claims the presence of corn in Ontario near the end of what’s known as the Middle Woodland period, i.e., 700-900 AD. There seems to be broad agreement corn’s dominance as a food source was well established in Ontario by 1000 AD.

When I first posted this column, I raised questions about how corn could have appeared in Ontario as early as 500 or 615 AD if it did not have a significant presence in the Mississippi and Ohio Valleys until a few several centuries later. I was also puzzled about how corn could have been grown in a sporadic manner during the introductory period given this crop’s vulnerability to wild animals. Small fields of corn within forests would have been decimated – just as they would now – by birds, raccoons, squirrels, deer and other animal pests, as well as over-run by weeds. It would seem that corn would have required decent season-long husbandry throughout the full season in order to ensure anything much at harvest.

Since the initial posting, I’ve learned both puzzles may have been answered – first by the discovery of corn remnants in southern Ohio dating back to about 200 AD – and second that corn was far from the first farmed crop in Eastern North America. Bruce Smith  and others have provided documentation that corn was actually a ‘Johnnie-come-lately’ to crop agriculture in this part of North America. Other plants including sunflower, cucurbits (gourds), and some chenopod species (lamb’s quarters and goosefoot) were domesticated and grown as farmed crops (i.e., planted, tended and harvested –  and with plants being modified genetically by human selection) as early as 2000 BC – two millennia before corn. By the time corn arrived as an imported species from Mexico and the southwestern United States, farming skills would have been well developed (even if farmed crops did not yet dominate the human diet).

Given that corn was present as a minor species in Ohio in about 200 AD, it’s not unreasonable for it to have arrived in Ontario by 500 or 600 AD, as noted above.

A large puzzle remains: If corn was present in middle/eastern North America by 200 AD, why did it take until at least 800 AD – and perhaps after 900 AD – before it became a major food crop in the Mississippi/Ohio river basins?

That this is so has been determined by analysis of the relative presence of the carbon isotope C-13 in human bones. The ratio of C-13 to C-12 (the usual form of carbon) is higher in organic compounds created by C4 photosynthetic species like corn than with most other farmed and wild plant species that have C3 photosynthesis. A higher concentration of C-13 in human bones, caused by a corn-dominated diet, was not apparent until after 800 AD.

Smith suggests that corn may have been used primarily for ceremonial purposes before 800 AD (like tobacco), or perhaps a long duration was required until productive corn varieties adapted to longer summer day lengths had evolved. (Neither explanation is that convincing in my view.)

In any case, the transition to a corn-dominated food system, once it began, spread rapidly within a period of 200 years or less from the Cado culture in eastern Texas right through to southern Ontario.

Archaeological records show corn was well established in southern Ontario by 1000 AD and indigenous people were highly dependent on corn for food, centuries before their first contact with white man.

Ontario Corn Farming After 1000 AD

2018-10-0022

Thanks to the efforts of Ontario archeologists, we actually know a great deal about indigenous peoples in Ontario beginning 1000 AD. Most of southern Ontario and up-state New York was populated by people who have been collectively called ‘Iroquoian.’ The Ontario Iroquoian were closely related to other indigenous nations in states south of New York, but were surrounded on the west (Michigan and extreme southwestern Ontario), north (about everything north of Huronia) and east (Ottawa Valley, most or all of Quebec, Atlantic Canada and New England) by a much larger group of nations known collectively as Algonkian. The Algonkian people in Michigan and New England were also corn farmers, but in Ontario and Quebec they were dependent (with a few exceptions) on hunting and fishing – and on trade for corn with nations like the Wendat.

(A note on indigenous names is in order here: I am not aware of any reaction to ‘Algonkian,’ but ‘Iroquois’ and ‘Iroquoian’ seem to be universally disliked by those so labelled. ‘Haudenosaunee’ or ‘People of the Longhouse’ are what I’m advised by a Mohawk friend to use to refer to the collective Mohawk, Oneida, Onondaga, Cayuga, Seneca and Tuscarora members of the Six Nations Confederacy. But when I asked him about the inclusion of the Wendat and other such nations, he had no advice. Wendat author Sioui recommends ‘Nandoueks’ to refer to the larger grouping, though I note he says it refers to “Wendats, Iroquois and other ethnically related Native groups,” which doesn’t solve my problem. I’ve not seen ‘Nandouek’ used elsewhere; hence, my ‘solution’ is to use ‘Iroquoian’ for the collective but not ‘Iroquois’ for any of its component groups.)

Much is made of the ‘Three Sisters’ – corn, beans and squash – in North American indigenous agriculture; however, archeologists report no indication of beans or squash throughout southern Ontario until at least 1400 AD, and only one archeological report of a single sunflower seed before then (dating to about 1350). Tobacco, used for ceremonial/religious purposes, arrived in Ontario about as early as corn.

Much of southern Ontario was unoccupied for extended periods of time and the occupied areas changed over the centuries. At the time of Champlain’s visits, in addition to the Huron and Petun, there were about 40,000 people known as Neutrals to the French – or Attawandarons to the Wendat – who lived roughly within the triangle between Oakville, St. Thomas and the Niagara River. Although information about the Attawandarons is much sparser than for the Wendat, it’s clear that their culture was almost identical.

There is ample evidence of Iroquoian culture north of Lake Ontario and into eastern Ontario during years prior to Champlain – people were closely related either to the Wendat, or to the Onondaga and Oneida people concentrated southeast and east of Lake Ontario.

When French explorer Jacques Cartier visited the sites of present-day Quebec City and Montreal in 1534-1535, he encountered corn-growing people who are now considered to have been members of the Onondaga nation. However, there was no sign of them when Champlain arrived about 70 years later; they are presumed to have been decimated by European diseases and/or warfare with Algonkian nations to the north.

Iroquoian Corn Culture

2018-10-0029.jpg

From F.W. Waugh. 1916. Iroquois Foods and Food Preparation

There is a good amount of available information on the culture and nutrition of Iroquoian nations, both from Europeans associated with the Huron people (Récollet and Jesuit missionaries as well as various visitors who wrote), and from similar writings about the Six Nations in New York State (especially the Seneca people who lived southeast of Buffalo).  Details on how that corn was grown and on the many dozens of food dishes based thereon, are well described in two historically important books – by A.C. Parker, NY State Museum, 1910, and F.W. Waugh, National Museum of Canada, 1916. (Details are provided below.)

They grew flint, dent (they called this ‘she-corn’), sweet and pop corn with the occasional mutant ear of pod corn as well (developed glumes around each seed), and both white and coloured.  Effort was taken to ensure varietal purity, though some cross pollination was encouraged.  The well-tillered plants usually had two to three ears per stalk, and 100 to 400 kernels per ear.

The men cleared the land by girdling trees and burning the dead tree skeletons a year or two later. Except for that, corn farming was done by women with help from children and slaves. (There is not much information in what I’ve read about slaves other than to acknowledge their existence; I’ve guessing that their numbers were quite small.) Corn seeds were planted, several at a time, into holes three feet or more apart. The seed was often treated with a water solution containing extracts of several wild plants to discourage crows.

Dead weeds from the previous year were cut off and removed at planting time. Weeds were removed by hoeing throughout the season. Fields were sometimes burned after harvest or before planting in springtime for pest/weed control.

After corn emergence, beans were planted, sometimes in each hill, sometimes in every seventh hill. Squash was commonly planted between rows. Fertilizer was not used though ashes would have provided some nutrients and beans may have provided some legume nitrogen.  Only certain East Coast tribes used fish as fertilizer and there is evidence that this technique was adopted only after contact with Europeans.

Worth noting is that these folks were totally into no tillage, the only tillage being the opening of holes for seed planting with a sharpened stick, a piece of deer antler or something similar. Even the most ardent no-till farmer in the 21st century does more tillage at seeding time than that.

Harvesting began with immature ‘green’ corn, some of which was roasted and preserved for winter food. Then came dough-stage harvesting, and finally mature corn.  Several foods were made from corn at each stage.  Mature corn was harvested, husks attached, and carried to the village or a central location where all but two or three husks were removed – generally at large social bees.  (They say young men often helped because it was a good place to meet girls.) Remaining husks were breaded to form strings of ears which were then suspended from the roof, walls and interior posts of longhouses until dry.  Most ears were then shelled and the grain placed in large bark bins up to six feet in diameter and height (up to 130 bushels) –  generally within the longhouses, though sometimes outside with bark roofs.

Harvested ears were also stored in cribs made of poles and bark or, when dry, in long-term, hidden, underground granaries.  These granaries, on well-drained sites, were commonly five-foot deep, lined with husks, grass or boughs, and covered when full with these same materials and then soil.  In fact, the lucky discovery (and theft, some say) of in-ground corn granaries prevented the Pilgrims from certain starvation during their first winter at Plymouth in 1620-21.

Enough corn was grown to provide a two- or three-year supply and also for trading.  Fur traders were regular customers in later years.

French governor Denonville and his troops spent ten days in 1687 burning Seneca corn bins and wrecking crops east of Niagara.  His claim of 1,200,000 bushels destroyed seems high, but they did demolish lots of corn.

In 1779, General Sullivan, as directed by George Washington, destroyed 40 Seneca and Cayuga villages and an estimated 160,000 bushels of corn.

The Jesuits report the average Huron diet was 65% corn, for a daily corn consumption of 1.3 pounds – or 8.5 bushels per person per year.  For a village of 2000 this meant about 17,000 bushels, or 430 tonnes.  Two years’ supply, plus corn to trade, meant grain stocks of at least 35,000 bushels (20 to 30 semi-trailer loads) – all carried in baskets for up to six miles from fields to the village. No wonder that early visitors reported Iroquois villages full of corn.

I can find no accurate record of yields though 30 bushels/acre seems reasonable, based on several sources.  Hence, a village of 2000 might require 600-1200 acres of corn.  The Lawson Prehistoric Indian Village museum (London) says the original settlement there numbered 2000 with at least 600 acres of crops.

References listed below provide ample details on planting and harvesting, and the many ceremonies and religious events associated with both.

2018-10-0027

From A.C.Parker. 1010. Iroquois Uses of Maize and Other Food Plants

Decimation of Wendat and Attawandaron in 1649-1651

This culture flourished in Huronia and among the Attawandaron until 1649-1651 when the Wendat and Attawandaron communicates were attacked and annihilated by the Five Nation Confederacy from New York State (later to become Six Nations when the Tuscarora nation from North Carolina moved north in about 1720). Although these were all Iroquoian people, there had been long-term hatred between Ontario- and New York-based nations. The attack was instigated partly because of that and partly because of a need for more beaver pelts for trade to Europeans. (The Wendat blocked direct trade between the Five Nation Confederacy and Algonkian nations to the north.)

The Wendat and Attawandaron numbers were badly weakened at the time by deaths caused by European diseases. Also significant was a split within Wendat society caused by the conversion of some of them to Christianity by Jesuits. (Converts were encouraged to avoid contact with those who weren’t.) In any case, after about 1651, the Wendat and Attawandaron communities in southern Ontario were no more. A few of them went to a new Lorette reserve near Quebec City, some to the Walpole First Nations near Wallaceburg. Some ended up in the Wyandot Reserve in Oklahoma. Some were absorbed by the Five Nations themselves, either as citizens or slaves. Only their memory remains in Huronia and the Attawandaron lands to the south.

In the decades to follow, some Iroquoian settlements were established in southern Ontario, especially along the north shore of Lake Ontario; the present Toronto and Prince Edward County were two sites. These were subsequently driven out before 1700 by Algonkian nations from the north, especially the Ojibwa who were known in the Toronto-Hamilton-Guelph area as Mississauga.

2018-10-0023.jpg

The Ojibwa were not farmers, at least not initially, and their culture in southern Ontario was mostly one of hunting and fishing. However, a series of land transfer agreements after 1780 meant that the Ojibwa people ended up in a number of mostly small reserves with limited potential for hunting. Though the land on most of these reserves is not well suited to farming, concerted efforts by government-appointed ‘Indian agents’ to promote agriculture meant that many Ojibwa people became farmers to some extent.

Six Nations Come to Ontario

The final chapter of indigenous farm culture in Ontario involves the Six Nations. In 1779, US army troops directed by General Sullivan and sent by George Washington destroyed the corn fields of about 40 Six Nations towns/villages in western New York State. (Washington accused the Six Nations of aiding the British though history suggests they were, on balance, neutral.) The resulting starvation forced the people to move near Fort Niagara on the east side of the Niagara River near Lake Ontario, to secure food supplies from the British. That relocation included temporary settlement in what’s now Ontario, west of the Niagara River. After the US War of Independence, Six Nations peoples were granted land along Ontario’s Grand River, and they settled at and southeast of the site of present city of Brantford. Some also settled in the Tyendinaga reserve near Belleville and on reserves near Cornwall Ontario, Montreal, and along the Thames River between London and Chatham Ontario.

The story of these settlements has been well described in many other places (including Arthur Ray’s book, I Have Lived Here Since The World Began, An Illustrated History of Canada’s Native People) and will not be repeated here. The Six Nations brought their corn-based culture with them and became well-respected farmers in Ontario on arrival. For a number of reasons, farming and corn growing diminished in the Six Nations reserves over the decades, but there has been a renaissance underway since the year 2000 – also a fascinating story, but beyond the scope of this article.

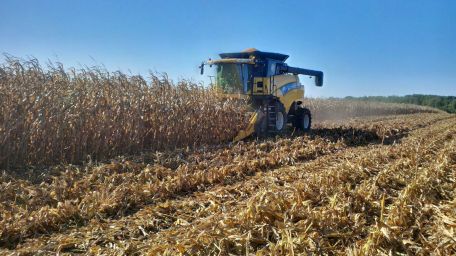
The European settlers in Ontario largely ignored corn except as a forage (silage) crop in most of the province, preferring to grow the grain crops that they had known in Europe (the exception being a few counties in extreme southwestern Ontario where corn remained dominant).

Then, starting about 1960, there was a resurgence in interest in corn in Ontario and within a couple of decades, it became, once again, the dominant grain crop in the province. Hence, the second millennium ended in Ontario just as did the first – with corn the dominant grain crop – albeit with a few changes in technology over those ten centuries.

Western Canada

Finally a note about corn in western Canada: Corn culture spread up the Missouri River Valley just as it did up the Ohio in years around and after 1000 AD. Corn was grown by the Mandan nation in the Dakotas, with evidence of it being grown in prehistoric times both north of Winnipeg and in south-western Manitoba. Wikipedia cites a reference stating that corn was grown by indigenous people at the mouth of the Red River, north of Winnipeg in 1790, a decade before the start of the Red River Settlement, though after the first visits by European explorers and fur traders.

Key References:

Cornelius, C. 1999. Iroquois Corn in a Culture-Based Curriculum. State University of New York Press.

Fischer, D.H. 2009 Champlain’s Dream. Vintage Canada.

Flynn, C. and E.L. Syms. 1996. Manitoba History: Manitoba’s First Farmers. http://www.mhs.mb.ca/docs/mb_history/31/firstfarmers.shtml

Ontario Archeology Society. The Archaeology of Ontario: A Summary. https://www.ontarioarchaeology.org/summary-of-ont-arch

Parker, A.C. 1910. Iroquois Uses of Maize and Other Food Plants. New York State Museum. (Reproduced by Iroqrafts, Iroquois Publications, 1983 and 1994.)

Schmalz, P.S.  1991. The Ojibwa of Southern Ontario. University of Toronto Press.

Ray, A.J. 1996. I Have Lived Here Since the World Began, An Illustrated History of Canada’s Native People. Lester Publishing.

Sioui, G.E. 1999. Huron Wendat, The Heritage of the Circle. UBC Press. (English edition, original published in French, 1994, by Les Presses de l’Université Laval).

Waugh, F.W. 1916. Iroquois Foods and Food Preparation. National Museums of Canada. (Facsimile edition, 1973, and reproduced by Iroqrafts, Iroquois Publications, 1991).

White, R. 1985. Ontario 1610-1985. Dundurn Press.

Wright, J.V. 1966. The Ontario Iroquois Tradition. Bulletin 210. National Museums of Canada. (Facsimile edition in 1973.)

Some good places for information:

Iroqrafts, Oshweken, Ontario. http://www.iroqrafts.com/

Huronia Museum, Midland Ontario, https://huroniamuseum.com/

Crawford Lake Iroquoian Village, near Campbellville, Ontario. https://www.conservationhalton.ca/park-details?park=crawford-lake

Lawson Archaeological Site, London, Ontario. http://archaeologymuseum.ca/discover-archaeology/lawson-site/

Column revised August 30, 2020

A ‘ Kentucky Derby Weekend’ Tribute to the Remarkable Dr. Bill Duncan

Bill Elizabteh Duncan 1968

Bill and Elizabeth Duncan, 1968

I’ve met many outstanding people in my long and convoluted career, but without doubt, the most unique and special person was Dr. W.G. (Bill) Duncan with whom I spent a year’s post doc at the University of Kentucky (UK).

Twenty-eight years ago, Dennis Egli at UK wrote a tribute and eulogy published in the Journal of Agronomic Education. This column is about my year with Bill, which began on Kentucky Derby weekend, 51 years ago.

In early 1968, I was finishing my third of three degrees at the University of Guelph and wondering what I (or rather, wife Dot and I) would do next. Finding a university position in those days was no concern – there were lots – and I knew that I would likely end up on the faculty at Guelph, so it seemed important to get some experience elsewhere, ideally outside Canada. I visited, considered, and was treated royally by several US universities – and was offered an exciting job with Pioneer in Johnston, Iowa. (I’d love to enlarge on the latter as it involved the opportunity for lengthy interaction with some corn legends including Drs. Bill Brown, Don Duvick, Forrest Troyer – and Ray Baker. Baker was brother-in-law of Pioneer’s founder Henry Wallace and with Pioneer from the beginning – but I will maybe leave that for another blog.)

In the end, I opted for a year in the Agronomy Department at the University of Kentucky. While only a 10-hour drive from Guelph, Lexington was located on the opposite edge of the North American Corn Belt – a very different growing environment. A sub attraction was chance to get to know Appalachia, just to the east of Lexington. But the biggest draw was the opportunity to work with Bill Duncan, one of the most unusual personalities in the world of plant research.

As it turned out, I was the only grad student or post doc that Bill ever had, (post docs were quite uncommon then, but grad students were aplenty.) I guess that makes me unique as well.

Lexington in May

Lexington Kentucky in early May.

Bill never talked much about his past, other than his love for Hopkinsville and Christian County KY where he’d spent most of his life. But I learned from others how he’d sold a farm fertilizer business and returned to Purdue for a PhD degree. Egli details that well in his tribute.

I was also told that while he had offered to work free at the University of Kentucky, he was actually paid $1 per year; the payroll listing enabled him to have a library card.

The story was that he was very wealthy, but we saw few signs of it. He and his wife drove cheap cars and lived simply in a modest bungalow. His one luxury item was a Cessna 210 that they used to fly often (with Dot and me on board frequently) to interesting places all across the US. I found out years later that Bill Duncan came from a long line of W.G. Duncans who had once owned a coal mine in western Kentucky (you can Google for more information; see photo below). The coalmine business was sold to the giant Peabody Coal Company and the W.G. Duncan I knew became a multi-multi millionaire. But, except for the plane, almost none of this showed.

I arrived first in Lexington (Dot came later) on Kentucky Derby weekend, first weekend in May, the time of year when Kentucky looks its best – and it sure looked beautiful for someone arriving from Ontario where daffodils were just flowering. After church on Sunday morning, Bill suggested we fly in the Cessna to have lunch with an acquaintance in Starkville Mississippi, and that we did  – maybe an hour and a half trip, returning a couple of hours later when it was still light. (From that, I got the idea from that Starkville and Lexington were closely located – an error corrected a few months later when we had occasion to drive it – almost as far as from Guelph to Lexington.)

Duncan's plane 1968

The beloved Cessna. Bill filling it with fuel for another jaunt. Dot and Elizabeth to the right.

Bill and his wife loved great restaurants too. One Friday they flew us up to Purdue, supposedly to check out something from a Purdue scientist, but the real reason was dinner at a Morris Bryant restaurant in West Lafayette – then overnight at the Purdue U student union and back to Lexington on Saturday morn. Bill and his wife Elizabeth treated us like family and to many family events we went; I’d love to enlarge on that but won’t. They were so kind.

However, what I appreciated most from Bill was what he taught me about crop physiology, agronomy and the pursuit of science. Bill was unique in that he had no research funding nor any interest in pursuing such. What he did in the way of fieldwork was minimal – and all done using borrowed help, land space and other resources. In fact, I think the year I was there may have been his only one with field plots. We planted one small demonstration for him and a replicated test for me in half a day.

So, with no research requests to submit or reports to file, no teaching and no admin responsibilities, he was unique but also very busy – spending his time visiting with other faculty members, travelling the country and the world to meet others, reading, thinking and writing – especially the latter two. He had a flair for computer programming and this led to the development of sophisticated crop canopy models for which he garnered international fame, as described by Dennis Egli. In those days, there was no charge to him to use the UK computing facilities. That worked well for a prof with no operating budget – and the same for a post-doc without operating funds, too!

Because of Bill, I had a short but useful career as a crop modeller too. Here’s one publication

Kentucky was then at the forefront of research and farmer experience on no-till agriculture, and Bill made sure that I was well exposed to that. We toured many plots, met farmers, and had many discussions on why plants performed as they did. That experience led directly to my strong interest in no tillage and my first no-till plots at Guelph in 1969.

Perhaps the highlight of the year was our discovery of the significance of the black layer as an indicator of physiological maturity in corn. When I had visited and been interviewed by Pioneer earlier in 1968, Don Duvick had loaned me his PhD thesis from Washington University in St, Louis. In it, Don had briefly described the formation of a dark ‘closing’ area in corn kernels as they matured. I had only skimmed this briefly, but Bill read it more thoroughly and mentioned this in our discussion the next day.

What followed was some daily kernel sampling of the four hybrids I’d planted that spring, A paper followed, The black layer and grain maturity in corn. The black layer is known by pretty much everyone who works these days with corn.

Black layer in corn Dupont Pioneer

Black layer development in corn. Photo courtesy of DuPont Pioneer.

Duncan had a million ideas, some which he could test using the UK computer (no desktops in those days, only the UK mainframe) and many others that he tested with endless discussions involving me and most of the Agronomy faculty.

Then the year was over and my scholarship funding from the Canadian NSERC program ended. It was time to move on. Dot and I moved back to Guelph.

Our ties with the Duncans weakened after that. He was disappointed that I didn’t go into international agriculture where he thought I’d contribute most, and my interest in agricultural extension (working directly with farmers) did not appeal to him to him at all. But we kept in close touch for many years, including his years spent in Florida, as Dennis Egli describes.

As a footnote, I had the opportunity, 33 years later, when I became an unpaid adjunct faculty member in Land Resource Science, University of Guelph, to try to emulate what Bill Duncan had done decades earlier at UK. However, it was different. You needed money for everything – use of the university computer, access to any greenhouse space, attend conferences and more – and I had no desire to rejoin the rat-race-chase for research money that I’d known 20-30 years before. The conversations that I had with other faculty members were just as rewarding as what I’d remembered from my UK days, but my attempt to become another ‘Bill Duncan’ proved largely unfulfilled. After a year and half, I moved on to something else.

I’ve had a career that has ranged widely: several years as a crop scientist at U Guelph and then exec VP for a major farm organization, stints as a university administrator, CEO of a bio-auto organization, and endeavours in renewable fuels, bioproducts, communications and nearly five decades of farming. But, the most productive and enjoyable was likely our year in Kentucky with Bill Duncan. I treasure every day we were there.

Duncan coal mine tokens

For history buffs: Token coins used as currency for employees of the W.G. Duncan Coal Company in Western Kentucky. A generation earlier than the W.G. Duncan I knew.


My Introduction to Dr. Christine Jones

2019-03-10 12_35_41-Welcome to Amazing Carbon!

For several years, I have occasionally encountered the name, Dr. Christine Jones, an Australian soil microbiologist. Perhaps because I’ve been spending more time recently reading about soil biology, I’ve encountered more references to her. Out of interest, I decided to investigate further. That was not too difficult given that she has provided links to her writings on a web site called, Amazing Carbon . The following is based on several articles posted there.

Dr. Jones is obviously deeply committed to soil improvement and the importance of soil microbial activity. What she promotes is a combination of both the orthodox and the unorthodox. There is no hint that any of this is done for personal gain or product promotion, other than for her own services as a consultant.

I like her emphasis on plant roots and root exudates because they are significantly more important for building soil organic matter than aboveground crop residues. She also emphasizes the importance of arbuscular mycorrhizal fungi (AMF) to soil health and plant growth.

Some of her other statements, however, make me quite uneasy.

She states in a March 2015 interview with Acres, the publication of an alternative-agriculture group in the United States, “If a plant photosynthesizes faster it’s going to have higher sugar content and a higher Brix level. Once Brix gets over 12, the plant is largely resistant to insects and pathogens.” I doubt that many plant pathologist and entomologists would agree that what is, effectively, lusher plant growth ensures pest resistance.

In the same interview, she expresses major concern about cancer caused by pesticides and other crop inputs: She states, “Not that long ago the cancer rate was around one in 100. Now we’re pretty close to one in two people being diagnosed with cancer. At the current rate of increase, it won’t be long before nearly every person will contract cancer during their lifetimes.” No mention is made of the age effect on cancer incidence (modern people live longer). When the age effect is removed statistically cancer rates are mostly stable over time or going down.

Dr. Jones expresses concerns elsewhere in her writings about claimed links between nitrogen fertilizers and health, and the general unhealthiness of modern farm crops and foods. These are claims that I don’t believe are much supported by most credible research.

On nitrogen, I also found this statement puzzling: “the application of high rates of inorganic nitrogen has many unintended negative consequences on-farm. These include deterioration of the water-stable aggregates important for soil structural stability.” Most soil scientists would argue, I believe, that nitrogen fertilizer at recommended application rates stimulates plant and root growth, thereby increasing the amount of soil organic material and helping to build water-stable soil aggregates. Of course, much depends on the definition of “high.” Maybe extremely high rates do affect soil as she states.

This excerpt, which appears in identical format in at least two or her articles, implies that crop plants are less affected by drought stress if surrounded by other plants (including weeds, I assume).

C. Jones drought photo

I was once involved in research on drought in corn and this disagrees with what we believed true then.

I am as keen as other farmers on cost-effective ways to increase the organic matter of soils. Dr. Jones devotes major attention to this subject. She expresses disappointment in scientists who say it’s difficult to do this, and presents her own numbers implying the converse.

I was intrigued by these paragraphs from a 2010 presentation at an agriculture and greenhouse emissions conference:

“Recent research by United States Department of Agriculture (Liebig et al. 2008) investigated soil carbon sequestration under a perennial native grass, switchgrass (Panicum virgatum) grown for the production of cellulosic ethanol.

“Despite the annual removal of aboveground biomass, low to medium rainfall and relatively short growing season, the USDA-ARS research, averaged across 10 sites recorded average soil carbon sequestration rates of 4tCO2/ha/yr in the 0-30 cm soil profile and 10.6tCO2/ha/yr in the 0- 120 cm profile (Liebig et al 2008).

“The best performing site was at Bristol [South Dakota], where soil carbon levels increased by 21.67 tonnes in the 0-30 cm soil profile over a 5 year period. A soil carbon increase of 21.67tC/ha equates to the sequestration of 80tCO2/ha.”

I checked the Liebig et al paper (link here). You might want to do that too. It involves 10 farm sites located in Nebraska, South and North Dakota.

As it turns out, the 21.67tC/ha value is not statistically significant different from zero at even P<0.10; hence, it’s the same for the 80tCO2/ha.

At some locations, for some soil horizons, there was a statistically significant (P<0.05) increase in calculated amount of soil organic matter (SOM) per ha. (In one case, there was a significant decrease.) However, this was often the result of an increase in soil bulk density, over time, rather than a change in percent SOM per se. There were also examples of decreases in soil bulk density and that can lead to spurious errors in calculations of percent SOM. (See explanation at the end of this column.)

I’ve no doubt that long-term production of switchgrass will increase SOM, though probably not nearly so much as implied by Dr. Jones in her reference to this paper – or in other writings involving other cropping practices too. It would be nice to believe that there is some combination of crops, soil microbiology and management that will lead to large, rapid increases in SOM content, but the science I’ve seen it’s highly unlikely.

The part about Dr. Jones writing which intrigues me most involves her claims that a ‘healthy soil’ can virtually eliminate the need for synthetic fertilizer applications. I can understand this to some extent with nitrogen where a high SOM content coupled with high microbial activity will lead to rapid SOM oxidation and N release. But the P (phosphorus) part is more complicated. We do know that soils contain lots of elemental P that is generally in forms unavailable to plants. Can the right combination of roots, mycorrhiza and other microbes release enough to make an agronomically significant difference? Dr. Jones says yes. It would be great if she was right.

Unfortunately, there is a substantial probability that, just as in other areas as shown above, she’s off the mark on this one too.

I emphasize again that I am not questioning Dr. Jones’ commitment to better soil health, and have no thought that she’s presenting anything other than what she believes to be 100% true. As for me, I’ll be looking for support from credible, peer-reviewed scientific literature.

—-

How bulk density affects measurements of soil organic matter

In an untilled soil, or even one lightly cultivated or disked but not mouldboard plowed, the organic matter (OM) percentage is highest near the soil surface and declines with depth.

Consider a naturally compacted soil with an OM percentage of, say, 5% in the upper 5 cm, 4% in the next 5 cm and 3% for 10-15 cm  of depth That’s an average OM of 4% for a 15 cm soil core.

Now consider what happens if the top soil is loosened substantially, say with a tillage tool or biological activity. In this case, a 15 cm core may now sample soil that was originally in just the upper 12 cm of depth. The average OM percentage is now calculated as (5% x 5 cm + 4% x 5cm + 3% x 2cm)/12 cm = 4.25%.

The measured OM percentage has been increased from 4 to 4.25% simply by soil loosening.

The reverse occurs with compaction.

Some researchers try to adjust for this simply by adjusting for the change in core weight. For example, if the density drops by 20% with loosening, to use the example above, the researcher would multiply the OM percent after loosening by 15cm/12cm, or 1.25, in computing total OM content in the soil. Unfortunately, this does not eliminate the sampling error.

A more proper technique is to sample the soil to varying depths depending on soil density so that the same weight of soil is sampled for all comparisons. Other approaches involve measuring the density and OM percentage for 5 cm soil depth increments and making calculations based on what would occur if the bulk density was the same for all layers.

Bottom line: Be very cautious in interpreting published data involving differences in percent soil organic matter when there are also differences/changes in soil bulk density (which is usually the case).

While I am at it, I believe there is another common error/bias in soil OM data involving comparisons of tillage with no tillage. With tillage, OM is incorporated into the soil and all soil samples taken thereafter include the incorporated OM. However, with no tillage, above-ground residue remains on the surface and is usually avoided in taking soil samples. Hence, the OM benefit with no tillage may be underestimated in these comparisons.


Can We Improve the Soil Sustainability of a Corn-Soybean Crop Rotation?


Corn-soy2


This is a personal analysis of our own farm. It’s posted here because the thought process and information might be of interest to other farmers asking the same question.

I’ll start with the conclusions. The explanation of how I reached them is provided in detail below.

I’d best call these interim conclusions as they are very likely to change; this is a subject on which I have much to learn. But based on what I’ve garnered thus far, these seem like the essentials:

  1. A rotation of corn and soybeans is inferior to corn-soybeans-wheat for soil organic matter maintenance/enhancement, but the difference is likely small, indeed non-existent if wheat straw is marketed off the farm, and cover crops are not used.
  2. The best rotational crop for increasing soil organic matter may well be corn, not wheat. Wheat plus red clover is better, but only if you get decent red clover stands. The worst is soybeans.
  3. Control of soil erosion using no-till soybeans and targeted seeding of winter rye into soybeans, or after soybean harvest, is the most important long-term consideration. I’m not keen on no-till corn for our farm, based on past experiences, but strip tillage would likely be better than our present once-over spring cultivation – for improving soil cover, reducing oxidation of soil organic matter, and reducing springtime earthworm mortality.
  4. Winter rye’s effectiveness in controlling glyphosate-tolerant broadleaf weeds should prove advantageous in years ahead – as the number of these species increases (at present, we have only fleabane) and herbicide-based solutions become less effective.
  5. Higher crop yields – coupled with less tillage – seem the best route for increasing soil organic matter content.
  6. Cover crops such as late-summer/early-autumn-seeded oats should also improve soil organic matter content but very slowly – if this can be done at minimal cost to make it economically justifiable – say, $15/acre, or less.
  7. Cover crop usage will not likely reduce our annual fertilizer bill.
  8. Economically, the weakest part of a corn-soybean rotation may be depressed soybean yields because of too-frequent planting of soybeans.
  9. I emphasize that these conclusions apply only to our farm, with no assumption that they are right for others.

—-

For more than 30 years, our small cash-crop farm near Guelph had a four-crop, five-year rotation of corn, soybeans, corn, white (navy) beans and winter wheat, but then we switched about three years ago to the simpler corn-soybeans. The reasons were several, but the main one was us getting older. We wanted something simpler.

That’s led to two questions:  Are we treating the soil properly? And if not, what can we do about it? That’s what this column’s about.

Soil erosion

The first priority in good soil management is eliminating soil erosion, or at least reducing it to the minimum possible.

We started farming in 1972 with no-till corn but a combination of the inadequate design of early no-till planters, inability to incorporate N and K fertilizer, and unsatisfactory yields meant a change to shallow, once-over springtime cultivation before corn. This is quick and cheap, and does a reasonable job of maintaining soil residue cover, though not as good as with no-tillage. With our no-till soybeans, much of the stalk residue from the previous corn crop remains on the soil surface to retard rainwater flow even after soybean harvest.

Despite the corn-soybean residue cover with no-till soys, I still saw some soil movement in areas of the soybean stubble where the rainfall runoff concentrated in early spring. Winter rye broadcast-seeded in those strips in late August before soybean leaf drop should stop that. Indeed, with that change, soil erosion should actually diminish with our shift to corn-soybeans.

IMG_20180921_112750

Winter rye broadcast seeded into soybeans

Calculations of soil organic matter additions

That brings us to the issue of soil organic matter management, which is far tougher. Organic matter is probably the most important soil-health criterion, as it has such a huge effect on water-holding capacity and drought avoidance. But increasing it is very difficult.

How does corn-soybeans compare to our former four-crop rotation, or to a corn-soybeans-wheat rotation which we could have chosen to use but didn’t?

In seeking answers, I found an excellent analysis done by Kludze et al (Bill Deen’s team) in 2010 at the University of Guelph. (A summary is here.) They used data from the Elora Research Station and across Ontario to calculate the amount of crop organic residue needed to maintain soil organic matter. In Table 1, I’ve used some of their numbers, combined with our 10-year crop-insurance yield records, to compare the three choices for cropping sequence.

Table 1. Calculation of organic matter return to the soil with three cropping sequences on the Daynard farm.

Crop or rotation Grain yield, 10-yr ave. Above-ground residue; assume harvest index of 0.5 Root:shoot ratio (including exudates) Roots and

exudates

Above-ground plus roots and exudates ‘Shoot-equivalent’ organic matter residue (shoot + 2.4 times root+exudates)
bu/acre dry t/ha dry t/ha
Corn (C) 166 8810 0.5 8810 17620 29950
Soybean(S) 49 2870 0.6 3440 6310 11130
Wheat ( W) 83 4780 0.8 7640 12410 23110
W. Beans (B) 36 1990 0.6 2350 4370 7710
Average per year
C-S-C-W-B 5450 6210 11670 20370
C-S 5840 6120 11960 20540
C-S-W 5490 6630 12110 21400
C-S-W (75% straw removed) 4290 6630 10920 20200

Notes: Harvest index = grain dry weight/(grain + above-ground crop residue). Values for harvest index and root:shoot from Kludze et al, 2010. White bean ratios assumed to be the same as for soybeans.

Considering only aboveground crop residues (column three), the corn-soybean rotation is about 9% better than both our former rotation and corn-soybeans-wheat. But when you include root-plus-root exudates (column six), corn-soybeans is slightly worse than corn-soybeans-wheat if wheat straw is not removed. In truth, given the crudeness of the calculations, all three rotations in column six, except for wheat straw removal, are about the same.

Many researchers have found root and root exudates to be a much better contributor to longer-term soil organic matter than above ground residues – 2.4 times better concluded Rasse et al (2004) in an extensive review. When I take this into account and calculate values for what I’ve termed, ‘shoot-equivalent’ organic matter (final column, Table 1), corn-soybeans-wheat turns out to be 4% better than corn-soybeans.

With cover crops

A common practice is to frost-seed red clover into winter wheat fields in March. This rarely worked satisfactorily on our farm, but other farmers have had more success. Another option – indeed, group of options – is to plant a cover crop into the stubble after wheat, into standing soybeans before leaf drop, or after soybean harvest. The calculations are more speculative than for corn, soybeans and wheat, given the huge differences that have been reported for cover crop yields and the sparsity of data on root:shoot ratios.

Using a variety of sources, including this, I’ve made some guesstimates for aboveground cover crop yield and assumed a cover crop root:shoot ratio of 1:1 (Table 2).

Table 2. Calculation of organic matter return to the soil with several cover crop options following winter wheat and soybeans on the Daynard farm, including a 2.4 weighting for roots + exudates.

Rotation Cover crop, above ground ‘Shoot-equivalent’ organic matter residue
dry kg/ha dry kg/ha
C-S-C-W-B 20,370
C-S 20,540
C-S-W 21,400
C-S-W with spring red clover 3000 24,800
C-S-W with cover crop planted in August 2000 23,670
C-S with cover crop 1000 22,240


The ‘shoot equivalent’ organic matter addition increases by 11% with cover crop planted after wheat and 8% with cover crop after soybeans. That’s assuming the cover crop grows adequately when planted after wheat or soybeans. That will not always occur and, hence, the 11 and 5% estimates are likely a bit high. Of course, the calculated value is lower if wheat straw is removal.

Rotational effects and cover crop effects on crop yield

The yields, and notably corn yield, shown in Table 1 are based mostly on a history of a four-crop rotation, but they might be different with other rotations.

Corn has yielded about 2% more in corn-corn-soybeans-wheat than in corn-corn-soybeans-soybeans on silt-loam soil at the Elora Research Station. At Ridgetown on clay loam soil, corn has yielded 13% more in corn-soybean-wheat in tilled plots but only 3% with no-tillage (data are in slide 14 here).

Conclusion: our corn would likely yield slightly more, though not dramatically so, with wheat in the rotation.

With wheat plus red clover cover crop, yield increases have been larger at both Elora and Ridgetown.

Data from both Ridgetown and Elora (see slides 23 and 25 here) show a significantly positive effect on soybean yields with the inclusion of wheat in the rotation, even when the soybeans aren’t planted directly after wheat. I don’t know whether this effect is caused by more wheat or less soybeans in the rotation.

Data showing any effect on corn and other field crop yields using cover crops seeded after wheat and soybean harvest are harder to find. Some reports show a yield increase while others show a decline. This report from Iowa State University explores the yield effects in some detail. The safest assumption seems to be no yield effect.

IMG_20140904_092207

Poor stand of red clover after seeding into wheat in early spring

Measurements of soil organic matter (SOM)

Any reasonable practice that increases SOM, consistent with the need for the farm to generate reasonable profits, is to be encouraged. Unfortunately that’s hard to do, as discussed by Poulton et al (2018) based on experience of more than 150 years of research at Rothamsted Research, United Kingdom.

Data collected after 20 years of crop rotational research at the Elora Research Station show a 5% (statistically non-significant) higher organic soil carbon content for corn-corn-soybeans-wheat compared to corn-corn-soybeans-soybeans, and another 1% increase if red clover is seeded into wheat. These are for the upper approximately 34 cm of soil depth. (The sampling depth was varied to adjust for differences in bulk density; that adjustment is critical as discussed by Poulton et al).

At Ridgetown, Van Eerd et al (2014) measured a 4% (statistically non-significant; averaged across two tillage regimes) increase in the organic carbon content for the upper 120 cm of soil after 11 years of corn-soybeans-wheat compared to corn-soybeans.

While farm publications often contain testimonials of major increases in soil organic matter occurring after a few years of cover crop use, supportive documentation in scientific literature is sparse.

Poeplau and Don (2014), in a meta-review of published research on effects of cover crops on soil organic carbon, concluded that “The time since introduction of cover crops in crop rotations was linearly correlated with [soil organic carbon] stock change (R2 = 0.19) with an annual change rate of 0.32 + 0.08 [t/ha/year] in a mean soil depth of 22cm.” Unfortunately, their analysis has critical flaws. For one, selected research papers  include several (and including most from Canada) that involve dedicated ‘green manure’ type crops grown for the whole season. Secondly, 70% of the selected studies include no measurement of bulk density; the authors attempt to estimate missing bulk density values using a single negative linear relationship between percent soil organic matter and soil density – for studies in 11 countries on four continents. There are also some weaknesses in statistical analyses. I’m very skeptical about accepting the conclusion from this review.

Calculating changes in SOM

A review of scientific literature suggests it’s difficult to predict changes in SOM content based on annual additions. So many other factors are important.

Kludze et al (2010) assumed, for the Elora Research Station, that 15.1% of crop residues are converted into soil organic matter and that, on average, 2.5% of resident soil organic matter is mineralized (i.e., respired, broken down, lost) per year. They calculated that a minimal annual addition of about 11 t/ha/year of crop residues, roots and root exudates is needed for SOM to remain constant. They assumed the same rate of decomposition for shoot and root residues/exudates.

I did similar calculations for a corn-soybean on our farm, using a range in rates of annual soil OM mineralization and decomposition of added crop residues, and including a 2.4 root/exudate weighting (Table 3).

Table 3. Calculations of soil organic matter losses and gains with various assumptions about rate of soil OM mineralization and annual decomposition of added residues, roots and exudates.

Rate of SOM mineralization (loss) per year (%)
2.0 2.25 2.5
SOM loss, kg/ha/year -1740 -1960 -2180
 
Annual rate of conversion of crop residues, roots, exudates into SOM (%)
10% 12.5% 15%
SOM gain, kg/ha/year +1490 +1860 +2230

Note: It is assumed a corn-soybean rotation adds 20,540 kg/ha of ‘shoot-equivalent’ organic dry matter per year (root and exudates weighted by 2.4), that soil is 4% organic matter in upper 15cm of soil and that soil bulk density is 1.45 g/cm3. Assume the added organic matter is 42% carbon and soil organic matter is 58% carbon.

Table 3 shows that by using different combinations of rates of annual SOM mineralization and addition, I can calculate either an annual gain or loss in SOM for our farm. If I use the Kludze et al choice of 2.5% mineralization and 15% annual addition, our farm soil breaks even.

Importantly, there seems no good reason to believe that our SOM is increasing, and it may be slowly declining.

Note, I am using the range in rates of mineralization and decomposition for a silt loam soil at Elora, which should be applicable to our Guelph Loam soil. These values would be different for a soil higher in clay (slower mineralization or residue decomposition because organic compounds are bonded to clay minerals), and the reverse for a sandy soil. (See Rasse et al.)

Effects of cover crops and higher crop yields

Any increase in annual addition through cover crops or other means will increase the likelihood of a gain in SOM.

Using the same calculation procedure used in Table 3, a cover crop seeded into or after soybean harvest would mean about a 250 kg/ha/year increase in SOM, assuming 15% annual conversion into SOM.

The 250 kg/ha/year equates to an annual gain in percent soil organic matter of about 0.01% with cover crop usage. That’s tiny though it does equate to nearly 0.5% gain over my 47-year farming career.

One other option is increased crop yields. What if our average yields were 20% higher – say to 200 bu/acre for corn and 60 bu/acre with soybeans? That’s a reasonable projection given expected genetic improvement. That would mean about a 620 kg/ha/year increase in SOM using the same assumptions – or about 2.5 times that which might be achieved using cover crops. Of course, it’s reasonable to consider both higher yielding crops and cover crops.

OLYMPUS DIGITAL CAMERA

No-till soybeans


What about tillage/no-tillage?

More soil tillage means greater destruction of soil micro-aggregates and faster microbial decay of the organic matter contained within. Organic matter left on the surface with reduced or no tillage also deteriorates more slowly (reference here).

The research data on changes in soil organic matter content with no tillage in Ontario are conflicting. Some comparisons show increased in soil organic matter with no tillage, some the reverse (reference here).

I’m of the opinion that lack of a decrease in soil organic matter may reflect lower crop yields with no-tillage – and with the lower annual organic addition more than offsetting a lower rate of organic matter oxidation in the absence of tillage.

Van Eerd et al (2014) at Ridgetown measured substantially more (>14%) SOM for no-tillage versus annual tillage. Corn generally yielded about 10% more with no-tillage in a corn-soybean rotation.

Dr. Bill Deen (slide 15 here) found corn yield at Elora to be higher with reduced/no tillage when corn followed soybeans, wheat or barley in rotation, but lower for corn after corn or wheat-red clover.

I prefer strip tillage for corn as it provides an easier opportunity for soil-incorporating P and K fertilizer, and perhaps nitrogen too, and counters the tendency for no-tilled soils to warm up more slowly in spring. I wish I knew more about relative effects of no-tillage, strip tillage and shallow-once-over-spring-tillage on earthworm mortality. I suspect that shallow spring tillage is bad, no-tillage is good, and that strip-till is somewhere in between. Some great references are here, here and here.

IMG_0359a

View of one of our fields

The ‘sleeper,’ continuous corn

According to Table 1, the best rotation for building soil organic matter would be monoculture corn.

But data from crop rotation studies in Ontario rarely show the highest soil organic matter levels with continuous corn. Perhaps that’s because corn mostly yields less in monoculture than in rotations.

That said, many Ontario farmers have grown corn successfully several years in succession – especially on sandy soils that need all the organic matter they can get.

Christine Brown of the Ontario Ministry of Agriculture, Food and Rural Affairs calculated in a 2017 presentation that a corn-corn-soybean rotation could be more beneficial to SOM than corn-soybeans-wheat. A corn-corn-soybean rotation would also address concerns about too frequent inclusion of soybeans in a corn-soybean rotation – though it would mean a yield reduction for second-year corn.

The calculations above are based on an assumption that all crop organic matter is equivalent for SOM enhancement, with the condition that root+exudate organic matter is 2.4 times more valuable. But farm experience indicates a faster rate of breakdown for some plant material, especially vegetative material that is lusher and with a lower C:N ratio. Highly suberized residue breaks down more slowly. (See Rasse et al for discussion.)

The answers are far from ‘all-in’ on relative merits of different cropping-tillage combinations for SOM preservation and enhancement.

IMG_20181004_153856_hdr

Crop residues with corn

Other cover crop benefits for our farm?

Deep-rooted cover crops can reduce soil compaction where this has occurred because of heavy field equipment travel, especially on wet soil. That’s not a priority on our farm, to the best of my knowledge, but it may be critical for others.

Water infiltration is a closely related issue with infiltration increasing in response to any technique that slows water flow across the soil surface or opens pores to deeper soil and tile drains below. Maintenance of surface residues with low/no-tillage is very effective. Earthworm-channel formation promotes infiltration as do dead-root channels. I’ve no doubt that cover crops would improve infiltration even more though it is difficult to quantify the benefit.

Weed control is another known benefit. Winter rye has been found very effective in controlling problem weeds like glyphosate-resistant fleabane. Should our existing weed control program prove insufficient for that purpose, rye will be the obvious choice.

A problem comes when the cover is incomplete (eg, red clover into wheat) and weeds grow abundantly in those patches if corrective measures are not taken. There is also need to ensure that the cover crop species itself does not become a weed of concern – and that new weeds aren’t introduced in cheap cover crop seed.

Finally, cover crops have been considered as a means of reducing nitrogen fertilizer need for corn. Research data show, consistently, the benefit of spring-seeded red cover. The same applies to a much lower extent for legume species planted after wheat harvest.

Research commonly shows lower soil nitrate levels in late autumn after cover crop establishment – at least for non-legumes species. However, the same plots often show little difference in soil nitrate levels in spring compared to soils without cover crops. Studies in Ontario have generally shown no reduction in N requirement for the subsequent corn crop after cover crops (legumes excepted, especially red clover). (See here and here, and also unpublished data from Greg Stewart, former OMAFRA corn lead.) Ontario crop consultants generally report no reduction in amount of N recommended for corn following a cover crop, unless the cover crop is a legume – and some consultants recommend more.

Acknowledgments

This column represents the culmination of a personal project of more than a year. I thank the following individuals for providing advice, insight and information (though none should be blamed for what’s written above): Drs. Laura Van Eerd, Bill Deen and Dave Hooker, and Ken Janovicek, University of Guelph; Andrew McGuire, Washington State University; Anne Verhallen, Christine Brown, Sebastian Belliard, Jake Munroe and Ian McDonald, Ontario Ministry of Agriculture, Food and Rural Affairs; Dr. Angela Straathof and Harold Rudy, Ontario Soil and Crop Improvement Association; Patrick Lynch, Peter Johnson (Real Agriculture), Greg Stewart (Maizex Seeds), Ken Nixon and several Ontario crop consultants (whom, for fear of missing someone, I’ll not list here); the many knowledgeable and experienced farmers I’ve interacted with on Twitter; and finally, thanks to you – all five of you – who have read this far!

Why Lynas’ Book, Seeds of Science, Made Me Angry! Fortunately, the Greenpeace Strategy Fizzled in Canada. Here’s Why


81sIu0k+wVL.jpg

I confess I don’t read that many books in a year – preferring shorter Internet features instead – but I’m sure glad I found time in 2018 to read Mark Lynas’ Seeds of Science.

This excellent book is actually a collection of mini-books, including ones on the history of crop biotechnology, on NGO-led opposition to biotech development in Africa, and on the story of Monsanto. He dwells at length on Monsanto’s beginnings including much on its years as a chemical company before biotechnology – attention that I found especially interesting as it may help explain Lynas’ expressed personal aversion to all pesticides (a dislike that I believe goes beyond the science of pesticide regulation and safety – more here).

The book features an expansion of his view that opinions on many issues are based more on ‘tribal membership’ than rational analysis. This includes a description of his efforts to rebuild his relationship with former UK environmental clan members that was shattered when he came out in support of farm crop biotechnology. (Not much evidence that he converted many of them in the process.)

But the part of the book which affected me most was the initial chapter which I acknowledge – at least during first time reading – made me very angry.

The chapter describes how Mark Lynas, as a twenty-something-year-old, became indoctrinated by a Greenpeace campaigner on the evils of genetically engineered/modified crops – and then played an active role in destroying crop biotech plots, spreading anti-GM fears, and otherwise undermining public confidence in Britain in technology that offers so much potential for human well-being.

That chapter reopened some very unpleasant personal history for me – even if the outcome of that history in Canada was far more positive than what Lynas describes for the United Kingdom.

Why Farmers and the Environment Love Bt Corn

While Mark Lynas was ripping out crop biotech trials in the UK, I was the executive vice-president (chief of staff) of the Ontario Corn Producers’ Association (OCPA) and also farming near Guelph. Corn farmers had watched as corn breeders, both public and private, devoted major resources – both money and time – to a search for improved genetic resistance to the European Corn Borer (ECB) using conventional breeding techniques. It was largely a futile effort because meaningful genetic resistance to this insect did not exist in Zea mays; the breeders were effectively segregating lines into ones that were susceptible to borer larvae versus those that were highly susceptible.

A typical farm cornfield during most of the 20st century in Ontario had many broken plants at harvest time caused by borer damage. It was worse if high winds prevailed. I personally spent many hours removing broken plants that plugged the header of my farm corn picker. Several farmers I knew had their arms ripped off when they carelessly placed a hand in the wrong place of a running machine during this process. After 25 years of ‘picking’ borer-damaged corn, I am lucky that both of my arms are still attached!

fad46s00i

Broken corn stalks caused by European Corn Borer

Corn borer damage triggered strong interest in large-scale insecticide application for borer control – as had already happening in France and then in Quebec and parts of the US Midwest. It was inevitable that it would happen in Ontario too, to the detriment of both farmers and the environment.

Then in the early 1990s we learned how biotech Bt technology – the transgenic transfer of a single gene from a bacteria used in organic agriculture into corn – could provide near total control. OCPA lobbied aggressively for Canadian approval. During late 1994 and 1995 scarcely a fortnight went by without a strong pitch to regulators in Ottawa to get Bt corn approved. We argued repeatedly that approval should come at the same time in Canada as the United States – to ensure competitiveness. (We came close: Canadian approval came within a week of approval in the US.)

It’s worth noting that our industry contact and the applicant for Bt approval in Canada was not Monsanto but, rather, the Swiss-based company, Ciba-Geigy (later, part of Syngenta). Monsanto was essentially a chemical and fledgling biotech company at the time, but with almost no profile presence in commercial corn breeding. (Its many purchases of plant breeding companies came later.)

Bt corn was an instant success in Ontario and the acreage of planted Bt corn grew rapidly beginning in 1996. The sight of entire cornfields with scarcely a fallen plant at harvest time was something new. Farmers upped their seeding rates (seeds per acre), yields increased, and still the plants did not fall over because of weakened stalks caused by borer injury.

None of us at that time – regulators or corn farmers – detected serious opposition from mainstream environmental NGOs. Indeed, we assumed they’d be delighted with new organic-based technology which all-but-eliminated need for post-planting synthetic insecticides.

Greenpeace Canada Gets Involved

I don’t remember specifics but I believe that it was in 1997 when we in OCPA became aware of fledgling NGO opposition to biotech-enhanced crops. It came to Canada from Europe and, to a lesser degree, the United States. Initially it involved individuals and local groups generally opposed to everything in modern field crop agriculture. But then Greenpeace Canada picked this as a priority issue and the game changed.

OCPA’s relationship with Greenpeace had actually been somewhat congenial up until that time. Greenpeace reps had visited us in Guelph a few years earlier to learn more about corn-based fuel ethanol and had offered to help in promotion. I recall a common news conference in Toronto.

(Greenpeace reps said that though they were not wildly enthusiastic about making fuel from grain corn, it was better than from petroleum, and a step to ethanol manufacture from cellulosic sources. OCPA was OK with that. Our corn plants contained cellulose too.)

download

At first, the Greenpeace opposition was tepid – after all corn growers and Greenpeace were allies on fuel ethanol – but it accelerated rapidly and our fuel ethanol-based friendship disintegrated. I recall asking a Greenpeace contact at the time why the organization could not separate technology (transgenic modification) from company (Monsanto). For in truth, while corn growers loved Bt technology, we were also displeased with the way in which Monsanto was then buying plant breeding companies everywhere.

The Greenpeace person was very frank: Greenpeace Canada got marching orders from head office in Amsterdam and the latter wanted issues to be simple. Simple meant that the ‘big arrogant American chemical company was trying to dominate world agriculture using biotech.’  Monsanto was bad and, hence, biotech was bad. No room for subtleties.

My contact left Greenpeace soon afterwards and that’s the last friendly conversation I ever had with that organization.

Ontario Farm Groups Attack Greenpeace

Initially, OCPA and other Ontario farm groups assumed that Monsanto and other biotech companies (or at least their Canadian offices) would be able to counter the Greenpeace campaign but we quickly realized that this was not going to work. Greenpeace was far more effective than corporate communications staff, even when coached by high-budget PR firms.

So the farm groups took a different approach, organizing  a collective effort which included OCPA , the Ontario Soybean Growers (keen to defend their usage of Roundup-Ready soybeans), AGCare (a coalition of Ontario crop farm groups created initially to address pesticide issues), Ontario Agri-Food Technologies (a coalition to advance new agri-food technology) and Dr. Doug Powell, then head of a very skilled food safety and communication group at the Ontario Agricultural College, University of Guelph. The approach included a flood of media releases and media interviews, large numbers of speaking engagements, and many personalized explanations about why family farmers and the environment loved the new biotech crops.

It also included direct attacks on Greenpeace.

The pitch against Greenpeace was simple – a huge multinational bully trying to squash small farmers trying to make a better world. Somewhere we discovered two nearly-identically worded news releases from Greenpeace condemning crop biotechnology, one from Amsterdam and one from Canada. The only difference was in the names of the quoted spokespersons (European versus Canadian). This served us well, too: Greenpeace Canada was simply a puppet of a multinational based overseas.

It got very personal. I recall a day of angry emails with a continual stream of copies going back and forth between me and other farmers, and the Greenpeace biotech campaigner located in Montreal. (This was just before the era of social media; now we would have used Twitter and Facebook.)

Greenpeacers were good at their job. They attempted to portray the farmers and farm groups as dupes of the chemical-biotech companies, but farm groups had been careful not to take money from the latter, and the GP message didn’t work that well. Greenpeace did not know how to respond when it was the one being portrayed as a multinational heavy attacking small farmers.

In truth, lack of operating money was not a major impediment since most of our operations weren’t expensive. But they did take a lot of time. More than a third of my time as executive VP was spent on this battle. Dr. Gord Surgeoner, president of Ontario Agri-Food Technologies at the time, devoted even more. Gord was a highly effective speaker, complementing Doug Powell’s media skills, and we had a lineup of media-trained, articulate farmers ever ready to be interviewed by anyone on a moment’s notice.

What we were doing was recognized outside Ontario and Canada. Representatives of both the National Corn Growers Association in the United States and the Association générale des producteurs de maїs in France came to visit to learn about our approach. A leader of a canola industry council from Western Canada stopped in to tell us that we as farmers were making a big mistake and would get burned for challenging Greenpeace; we ignored him. One major disappointment was the failure of potato producers in Atlantic Canada to support our efforts in favour of Bt potatoes – for we also grew some Bt potatoes in Ontario and were well aware of the benefits in reducing pesticide usage.

(When Bt potatoes were first marketed in Atlantic Canada, they initially enjoyed a market-price premium because of reduced pesticide usage. That all changed through a combination of Greenpeace-type pressure and lack of action by local producer groups. Bt potato production ceased and Atlantic potato growers have been hounded ever since for their heavy usage of insecticides.)

potato_cpb_14_zoom

Injury caused by Colorado Potato Beetle which can be controlled by Bt technology or pesticide applications

Perhaps even sadder was the way in which the Canadian wheat industry opposed biotechnology that offered such promise for that crop too. The Canadian Wheat Board (CWB) (government run but with some producer-elected board members) actually staged a joint news conference with Greenpeace in Winnipeg, repeating some of the latter’s lies about the safety of biotech-enhanced crops.

I personally stopped growing wheat a few years ago, having grown weary of near-static yields and the several pesticide applications needed to ensure success. Perhaps acceptance of biotechnology in the wheat industry might have made a difference.

Greenpeace Canada Ends Campaign

The Greenpeace campaign in Canada ended very abruptly in about 2001 or 2002 – I don’t recall the exact date – when their GM campaigner suddenly quit and left Greenpeace. He was not replaced.

Perhaps we played a role – his resignation came shortly after a particularly heated email exchange with farmers – or perhaps not. Sixteen or 17 years later, that position has not been refilled and Greenpeace Canada is not active today in anti-GM campaigning.

This all happened more than a decade and a half ago and the world moves on. Anti-GM crop activism is alive again – or perhaps still – in Canada, though not nearly with the same high intensity as existed at the beginning of this century. (Tides Canada has an anti-GM program, possibly funded in part using funds from the parent Tides organization in San Francisco. However, its efforts are quite low-keyed compared to former efforts by Greenpeace Canada.)

I thought I’d also moved on personally – at least until reading that initial chapter of Seeds of Science when it all came back.

I’m still angry at efforts by multinational Greenpeace to destroy technology that has proven so beneficial in limiting pesticide usage – and still 100% effective in protecting Canadian cornfields from European corn borer infection.

As a postscript, insecticide spraying has again returned to some Ontario corn fields, not for control of ECB but rather Western Bean Cutworm, an insect which aids in the infection of corn kernels with mycotoxin-causing fungal disease. The race is on to develop alternative biotech control. But at least this time, Greenpeace Canada is unlikely to be a notable opponent.

Comments on: “When Too Much Isn’t Enough: Does Current Food Production Meet Global Nutritional Needs?”

vegetables

An October 25 news article entitled “ Not enough fruits, vegetables grown to feed the planet, study reveals,” caught my attention, partly because of its title and its University of Guelph origins (my alma mater and former employer), but also because of some statements/conclusions seemed false. I read the referenced research paper in detail (Krishna Bahadur KC et al, https://doi.org/10.1371/journal.pone.0205683, October 2018) and am providing this overview and critique for those who may be interested.

The paper claims to show that the world is unlikely to be able to meet its need for a quality diet in 2050 without major increases in land usage for agriculture and greenhouse gas emissions. However, I conclude that dubious assumptions and apparent flaws in the calculations cast major doubt on the validity of this conclusion. I explain why below:

In brief, here are some of the major findings and conclusions:

I’ll discuss them in more detail later.

  1. If the world continues to consume its present average diet, we’ll require almost no increase in arable land to feed 9.8 billion in 2050, but a 40% increase (about 1.4 billion ha more) in pasture land. That’s based on an assumed 1% annual increase in the productivity of arable land but 0% for pastureland and for the conversation efficiency of livestock (discussed below).
  2. If we switch to the superior diet which the authors have designed based partly on Harvard Health Eating Plate (HHEP), this would mean a small (4%) decrease in arable land required by 2050 but a 59% increase in pastureland. This, in turn, would mean a 108% increase in greenhouse gas (GHG) emissions from agriculture. That does not include any emissions associated with the conversion of non-agricultural land (presumably forest, natural grass and conservation/park lands) to pastureland. The authors propose converting the 4% ‘saving’ in arable land usage into biologically diverse habitat rather than using it to diminish the added requirement for pastureland – stating this is for a net environmental benefit. However, the rationale is not explained. The apparent assumption is that converted arable land makes better natural habitat than the equivalent hectares (or more) of additional forest and/or natural grassland converted into grazing land.
  3. If we switch to a vegetarian diet which includes milk but no meat consumption, which the authors suggest as an option, that would mean an 8% increase in arable land usage compared to present (an increase equivalent to about twice the current arable ha in Canada) but a 10% decrease in pasture land by 2050, and also a 12% reduction in GHG emissions. This does not include any GHG emissions associated with the conversion of non-arable land to arable, and assumes that the productivity of the converted land will be the same as existing arable hectares. The authors’ calculations assume the elimination (burying, burning, or other disposal) of the bodies of cull ruminant animals raised for milk, but not used for human meat consumption, on 3 billion ha of pastureland. More on that below.
  4. The authors considered a fourth alternative that involves a major reduction in meat consumption (20% of the ‘protein’ part of diet from meat, versus 65% as calculated for HHEP). They estimate this will require a 5% and 6% respective increase in arable and pastureland needed in 2050, compared to 2011 – and about a 56% increase in GHG emissions, if I interpret their data correctly. (The relevant supplementary table contains some apparent labelling errors.) The unlikelihood noted in the previous paragraph may also compromise these calculations – in fact to a large extent – if meat from dairy ruminants is not included.
  5. The authors also discuss three other options for meeting nutritional goals with available land resources: Improving the GHG efficiency of animal, crops and seafood production; increase research to increase yields of fruits and vegetables by 8% per year and livestock meat by 3% per year; and reducing food wastage. The authors provide limited insight as to the likelihood of achievement with any of these.
  6. In the above, authors assume that the world is one homogenous pool of production and consumption, and that global needs can be calculated without considering differences in regional balances of supply and demand/need – nor difficulties and costs involved (including GHG emissions) in shipping surplus food ingredients from one region/country to another. More on that below, as well.
  7. The news release contains a claim that vegetable and fruit crops are higher yielding than grain, oilseed and sugar crops – with the implication that arable hectares required for food production can be reduced by shifting land from the latter to the former. (The paper provides no supporting data or references for this claim, which in fact is at odds with contents of the paper itself, and is almost certainly false.)
  8. The news release also implies that government programs for grain and oilseed crops are a major reason why farmers grow too much of them and not enough fruits and vegetables. There is no consideration of market place realities and that farmers generally grow food crops for which consumers are willing to pay (at least enough to cover costs of production). This issue is not raised in the paper itself.

A quick review of methodology:

As a first step, the authors calculated the daily intake of various food groups needed for a healthy diet, based partially on the Harvard (university) Healthy Eating Plate (HHEP). Authors then calculated the amount of each food group produced globally using an FAO data base, and compared the land need for world population of 7 billion in 2011 and an estimated 9.8 billion in 2050. The authors assumed an average annual 1% increase in per-ha productivity for all arable crops but no increase for pasture crops or in the efficiency of converting crops into milk and meat. (The assumption about lack of change in pastureland and livestock productivity is not stated in the paper but was provided in conversation with the senior author. This assumption is the reason for calculations showing a far greater future need for more pastureland compared to arable land.)

The paper also includes an allowance for food provided by ocean fisheries and assumes 20% household food wastage.

The rationale for choosing the HHEP guidelines and for the way in which they used it is murky. They state that they considered using Health Canada recommendations, but didn’t because of a published suggestion from one writer, Dr. Marion Nestle (a professor at New York University, known for her very negative views about food companies), that these could be biased. There is no indication that sources other than HHEP and Health Canada were considered.

Also puzzling is the fact that, despite specific instructions in the HHEP reference that these guidelines “are not meant to prescribe a certain number of calories or servings per day,” authors of the current paper do just that. Then they go further in making some estimates of what the HHEP guidelines mean; for example, the HHEP statements of “protein power – ¼ of your plate” and “healthy plant oils in moderation” are interpreted by the authors (no reference cited) to mean “1 serving of fat/oil, 1 serving of milk/dairy, and 5 servings of protein.” The authors further divide ‘protein’ into plant and animal protein sources (65% animal according to an appendix table).

The HHEP guidelines are clear that potatoes are not to be included in the vegetable portion of the ‘heathy plate’ because of the nature of their carbohydrate composition (too easily digested). However, the authors of the paper included potatoes in their calculations anyway. The authors show that potatoes represent over 18% of the world’s current hectares devoted to vegetable production for direct human consumption. (This increases to 31% if cassava, with a carbohydrate composition similar to potatoes, is included.)

The authors state that HHEP guidelines say red meats should be restricted to two portions per week, though I could not find that advice stated anywhere in the literature citations, and it doesn’t appear to figure directly into their calculations.

These assumptions and omissions seem very significant to me in that modest changes in diet might be expected to mean very large changes in the predictions. For example, the authors note that use of Health Canada’s dietary guidelines would have meant “27% fewer servings of fruits and vegetables, 34% fewer servings of meat/protein, but 60% more servings of dairy products and 25% more grains,” compared to their idealized diet based in part on HHEP.

A few other comments:

The assumption of a zero increase in pastureland productivity between 2011 and 2050 seems extreme and unrealistic. Indeed, the authors cite an example of how pasture management can be improved, and another describing research to improve the efficiency of livestock feed conversion. A quick Google search found this review detailing how feed conversion efficiency has improved for dairy cattle and outlining opportunities for continued improvement.

A weak understanding of livestock, especially ruminants, seems apparent in the paper. I’ve already mentioned the assumption of milk but no meat from dairy animals. I know that there are some countries/regions where cows are milked but not used for meat but these represent a minute share of world production. India, where cows are prominent but bovine meat consumption is not, is actually the world’s largest or second largest exporter of beef meat. The authors present calculations that only 30% of present world pastureland is used to produce meat and the rest all for milk/dairying milk. I also doubt the accuracy of that that figure. The concept of dual-purpose ruminant animals (milk plus meat) is not mentioned.

If meat from dairy animals is included in calculations of global food consumption, as would seem the most logical assumption, there may also be critical flaws in their calculations for a low-meat-but-full-dairy diet. (A check of their data suggests that the authors have likely ignored meat from dairy animals, but it’s ambiguous.)

I question the authors’ calculation of 1% average annual increase in productivity of arable land, for it turns out that this assumes no trend for increased annual improvement between now and 2050. The increment each year until 2050 is assumed to be 1% of crop productivity in 2011. Hence, the productivity in 2050 is calculated to be that of 2011 multiplied by 1.39 (39 years). But what if that average 1% is accumulative, as seems more logical, i.e., 1% of each previous year? The annual productivity in 2050 would then be that in 2011 multiplied by 1.0139. This calculation would mean 8% greater arable production in 2050 or equivalent to the production from about 80 million ha. Compare this with a quote from one of the authors in the news release, “Without any change, feeding 9.8 billion people will require 12 million more hectares of arable land.” I suggest the 12 million is like a rounding error, compared to the uncertainty in assumptions.

The authors ignore options for meeting nutritional needs in 2050 other than shifting portion sizes among various food groups. It may make sense to eat more carrots to get vitamin A in Canada, but in Southeast Asia? Why not genetically bio-fortified rice or the similar advances now in development with cassava and bananas in Africa? There is lots of research underway globally on improved nutritional composition of agriculturally based foods.

A similar comment applies to assumed primacy of the HHEP diet. My impression is that the developers at Harvard created this for Americans or others who eat similar foods. But why assume this idealized diet applies to someone in Uganda or Bangladesh?

My biggest concern with the study

It’s the assumption that world agriculture and food supply/demand is one big pool and that regional distinctions are of negligible significance.  A proper analysis, in my view, should allow for inter-regional shipments, of course, but must also recognize need for a substantial degree of regional self-sufficiency. (The experiences of 2008 and its food supply/price panic showed the importance of that.) It should also recognize regional differences in what is considered a proper, balanced diet. If that were done, the conclusions in this paper might change very substantially.

So what do we learn from this paper with everything considered?

The main conclusion is that if the world’s citizens shift to a diet which contains fewer grains, oilseeds and sugar, and more fruits, vegetables and protein, then farmers will need to grow more of the latter and less of the former. Will this require more or less land? We don’t really know from this paper. It all depends on assumptions.

The paper would appear to show that it will be almost impossible for the world to meet future nutritional needs without animal agriculture. That’s a huge issue considering the abundance of attacks these days on animal agriculture. Unfortunately, given the weaknesses in the paper’s calculations, especially concerning the use for meat of dairy animals, no conclusion is possible using the analyses in this paper.

As for effects on GHG emissions, it depends largely on assumptions about relative dependence on livestock production – as we already know from many previous publications and analyses.

I do thank the authors for stimulating lots of thought – for both me, for sure, and I expect many others. A special thank you to senior author, Dr. Krishna KC who was very gracious and open in discussing the paper with me, clarifying some ambiguities.

In closing: Before posting this critique, I provided a draft copy to key several key authors requesting their advice on where my comments were in error or unjust. The responses identified neither errors nor unfairness, but stated simply that their paper was intended to stimulate discussion.

Comments on: Association of Frequency of Organic Food Consumption with Cancer Risk

Organic-logo

Comments on: Association of Frequency of Organic Food Consumption with Cancer Risk – Findings from the NutriNet-Santé Prospective Cohort Study

Paper by Baudry et al, JAMA Internal Medicine, October 22, 2018

For those who may be interested, I’ve reviewed this paper in some detail and have also read related reviews by others (listed below). Here’s a quick overview:

The authors conclude, “higher organic food consumption is associated with a reduction in the risk of overall cancer,” and “promoting organic food consumption in the general population could be a promising preventive strategy against cancer.” The authors also make it clear that they believe the differences they found are likely the result of higher pesticide residues in non-organic foods.

The study involved recording of the incidence of several types of cancer over an average of 4.5 years for 68 946 French volunteer adults who, on their own initiative, participated in a large national study on food consumption and health. Participants completed a questionnaire near the beginning about their consumption of 16 categories of foods and the extent to which consumption of each was ‘most of the time’ (assigned a numerical rating of ‘2’), ‘occasionally’ (rating of ‘1’) or ‘never’ (rating of ‘0’) of organic origin. Estimates of individual daily quantitative intake were also collected. Of the 68,946 volunteers, 1350 – or 2% – were afflicted with first-time cancer during the study, and the authors quantify the incidence of several forms of cancer.

The authors make no attempt to hide conflicts of interest, acknowledging an association with the entity, Fond de Dotation Institut de l’Alimentation Bio (an institute for organic food). The literature review includes dubious/erroneous statements such as this: “natural pesticides allowed in organic farming in the European Union exhibit much lower toxic effects than the synthetic pesticides used in conventional farming.” (For information to the contrary, check https://risk-monger.com/2016/04/13/the-risk-mongers-dirty-dozen-12-highly-toxic-pesticides-approved-for-use-in-organic-farming/ ).

The authors have been condemned by others for their conflict of interest and apparent bias, but I’ll not do that. Virtually every researcher has inherent bias and this study, like all others, must be judged on its scientific merit, not the personal views of the individuals involved.

The large number of participants is both an asset and a problem. No one can criticize it for inadequate sample size, but at the same time, the huge number of data points complicates the statistical analysis. Trivial differences may be shown as ‘statistically significant’ mainly because of the very large number of ‘degrees of freedom’ (a statistical term for those not familiar).  For example, Table 1 in the study shows people who consume more organic food are shorter at a P<0.001 (less than one chance in 1000 of being due to random chance).

There are a lot of confounding factors in the study. For example, the data show that those who consume more organic food are more likely to be female, older, better educated, wealthier, former smokers, have a history of family cancer, less over-weight, and eat less red meat and processed meat (Table 1). The authors claim to have removed the effect of such confounding by statistical adjustments though they don’t state how this was done; a deep suspicion exists, for both me and others, that serious confounding remains even after adjustment. For example, the most common way to remove the influence of confounding is by linear adjustment. But what happens if the confounding influence is not linear? (We know, for example, that the relationship between age and cancer incidence is nonlinear – an accelerating likelihood as you get older – and those who consumed the most organic food in this study were older on average.)

With all of the comparisons made in this paper between categories of organic consumption and population traits it is certain that some would be found to be statistically significant at P<0.05. Some results in this study are significant at this level – for example, a claimed relationship between organic food consumption and incidence of Non-Hodgkin lymphoma (NHL), at P=0.049 – but is this real or just what would be expected by random chance? (The data show no dosage response between reduced NHL affliction and increased organic consumption except for those consuming the most organic).

And there are some really oddball findings. For example, the incidence of cancer was no higher for those eating a low-quality, non-organic diet than with a high-quality-plus organic regime. However, if the ‘quality’ of the diet improved (less processed meat eaten, as an example), then risk of cancer increased unless there was a corresponding increase in organic consumption. (The implication is that if you don’t eat organic, then you should also eat a lower-quality diet to minimize the risk of cancer.)

While the number of people surveyed in the study is huge, it cannot be termed a representative sample of French society. For one, participants were 78% female. For another, individuals who participated were likely predisposed to respond to a voluntary survey on health. The results cannot be dismissed as meaningless because of this – but neither can they be assumed representative of a population other than those who self-selected to participate.

A major weakness in my view is the assignment of individuals to various categories of organic consumption based on a questionnaire self-completed about 2 months after enrolment and estimates of portion-size consumption made during three 24-hour periods. The assumption is that dietary patterns did not change during the nearly 4 ½ years which followed. There was no apparent effort made to confirm the accuracy of the initial self-assessment process, nor to ensure consumption remained the same a year or two – or four- after the initial assessment.

The results do show statistically significant negative relationships between certain types of cancer incidence and increased organic food consumption – for example, for older females with higher body mass indices who are more highly educated, former smokers and with a family history of cancer. By contrast, the authors note, “When considering different subgroups, the results herein were no longer statistically significant in younger adults, men, participants with only a high school diploma and with no family history of cancer, never smokers and current smokers, and participants with a high overall dietary quality.”

From my perspective, it is hard to understand how organic food would change susceptibility to cancer since most surveys show its nutritional composition to be virtually identical to its non-organic counterpart. See here for example. (There are some exceptions: for example, this study found higher levels of certain fatty acids in organic milk – which is most certainly related to a higher relative perennial forage intake for organically raised cows. The same would likely be achieved with a high-forage, non-organic diet.) While, detectable residues of synthetic pesticides are more common in non-organic crops/foods, the levels are almost always far below concentrations considered to have toxic effects according to some well-established science. And the above excludes recognition of organic pesticides which were not considered in the Baudry paper and which are also toxic at higher concentrations.

Carl Sagan is credited with the statement, “extraordinary claims require extraordinary proof” and that would certainly relate to the claim about organic foods reducing cancer. Unfortunately the paper by Baudry et al comes far from providing extraordinary proof – if, indeed, it provides any proof at all.

Other reviews of this paper include:

Organic Foods for Cancer Prevention—Worth the Investment? Hemler et al., JAMA Internal Medicine, October 22, 2018

Viewpoint: Chemophobia epidemic—Fanning fears about trace chemicals obscures real risks and ‘damages public health’ Jon Entine, Genetic Literacy Project, October 24, 2018

Organic Food Consumption and Cancer Jayson Lusk, Purdue University, October 24, 2018

No, Organic Food Doesn’t Reduce Cancer Risk. That’s Biologically Impossible Alex Berezow, American Council on Science and Health, October 22, 2018

Twitter thread by Bill Price (@pdiff1), University of Idaho, October 24, 2018

Twitter thread by @TamarHaspel, Washington Post columnist, October 23, 2018

Twitter thread by @AlanLevinovitz, James Madison University, October 23, 2018


The Kevin Folta I Know – And What About That Industry Money?

IMG_20161113_191523a

Kevin Folta and a on-campus sign promoting his talk to an event organized by undergraduate students at the University of Guelph.

I first met Kevin Folta almost five years ago when he spoke in a livestock pavilion in the small Ontario ag-college town of Ridgetown on the topic, science and public perceptions. I’d puzzled, how could a horticultural researcher from Florida connect with an audience of mainly corn-soybean-wheat-livestock farmers a thousand miles further north. But connect he did and connect so well, using language free from academic jargon, focusing on fact not rhetoric, using a low-key, unassuming manner – in flawless delivery without a speaking note.

The next came in late 2016 when, thanks to some inadequate coordination by the respective organizers, Kevin Folta spent five days in/near Guelph to speak at separate undergrad and grad student events and a provincial conference on crop pest management, with a long-weekend coming in the middle. I was a participant at two of these events and his host for much of the weekend. I came to know a humble person, without a hint of complaint about the inefficient use of his time, and eager to interact with students and others in the audiences and in the pub before or afterwards. We visited Mike Dixon’s lab in Guelph and travelled to a floral greenhouse near Vineland and Niagara Falls; that’s where I realized that his personal research was on light quality effects on plant morphology – highly important to his greenhouse host, but quite removed from the world of genetically modified crops. Folta had no reason to give a damn about the well-being of field crop growers or food consumers in Canada. But he was in Ontario for that purpose because he cared.

His message in the three talks (all distinctly different but with a common theme) was about finding common ground with those of differing views, and about sticking to good science in messaging. Though Folta had ample reason to be bitter and vindictive, given the way he had been attacked by so many including a lead story in the New York Times, he was the reverse. He said he’d spent years in attack mode only to learn that this approach didn’t work. He’d concluded that simple, objective explanations, which acknowledged credible arguments by opponents, could work better, and that’s the Folta we saw in Guelph.

I discovered afterwards that Folta had spent part of a weekend afternoon in Guelph meeting a local, well-known anti-GM opponent in the hotel coffee shop. He thought that was a fair thing to do. His reward was to have her condemn his integrity in social media afterward.

My last direct contact came in June last year when Folta was among other public researchers who participated in a biotech conference at Guelph. He travelled via Buffalo airport and hitched a ride to Guelph, versus a more direct flight to Toronto, in order to keep his travel costs down for organizers. His message in Guelph was the same: finding common ground where possible with opponents, taking the high road, sticking to scientifically credible arguments. When he left for his ride back to Buffalo airport, I said goodbye to a good friend and someone who I continue to hold in the highest regard.

So what about the flurry of high-profile public criticisms about this man in social media and elsewhere?

I’m not talking about attacks by anti-GM advocacy groups – they recognize Folta’s effectiveness in communication and are committed to undermining this in any way possible – but rather those coming from individuals who would seem to be allies.

I have not followed all the nitty details and claims nor do I intend to. I gather that he claimed no travel support from Monsanto for travel to GM-related events in Hawaii when some financing likely came from a general donation from that company to the University of Florida. Though I’ve seen no evidence that this money affected his messaging, his claim was likely an error in judgment.

Recently he’s been accused of not disclosing some work he did in reviewing data for a law firm likely linked to Bayer. Again no evidence that this affected messaging or research integrity. I am not sure that, in the same situation, I would have felt the need for public disclosure either.  He did inform his dean as required.

If there was a serious ethical misstep, in my view it is that of two research colleagues who apparently filed a Freedom of Access to Information request to the University of Florida without telling Folta, found reference to the law firm incident, and informed the world via a high-profile blog.

There are also allegations of personal indiscretions but I’ll not go there. They are personal and if they do involve violations of ethics and law, there are proper procedures for punishment and redress.

In total, what this tells me that Folta is not a saint but human like everyone else – but with the misfortune to have his acknowledged or alleged flaws broadcast to the world – a direct consequence of his high effectiveness as a communicator and agricultural advocate, for sure.

Before closing, I’d like to address the issue of industry connections for university and other public scientists. There seems to be an attitude that if you accept industry money for anything or – even worse – work for industry, you are somehow a lesser creature with lower credibility and standard of integrity. I know agricultural researchers at the University of Guelph (the ag university I know best) who will not accept any industry money, some even refusing to use departmental facilities funded by industry.  They see this as a higher level of purity (usually coupled with the good fortunate to work in a subject area which government views as a priority for funding).

I view them with contempt.

I have worked in academia, as well as for farm and other industry organizations; I’ve interacted closely with many government researchers, administrators and politicians; and my wife and I have run our own small farming business for 46 years. I have seen not an iota of evidence that employees in industry operate with less integrity than those with public salaries.

Did Dr. Cami Ryan become less ethical when she left the University of Saskatchewan to join Monsanto? Did Dr. Mary Dell Chilton, co-winner of a recent World Food Prize, lower her ethical standards when she left Washington University for industry a few decades earlier? The same for four of my former faculty associates in the Department of Crop Science at Guelph who left academia for positions in plant breeding companies about the same time as I left to work for a farm group.

The answer is an emphatic NO in all cases. Those professionals and hundreds more like them are every bit as committed to the welfare of agriculture, farmers, consumers, natural environment and global well-being as their academic or other public counterparts. Of course, they have conflicts. But those same conflicts apply equally for public researchers who take certain positions (whether they secretly agree or not) to be seen as being on the side of public opinion, or to get tenure or promotion, or – usually more importantly – to be competitive for public grant money.

As a farmer, I see it as positive when a public researcher has worked with industry – using industry money to pay for research and other operating costs as the need arises. That experience is worth far more than any so-called purity associated ‘I-won’t-accept-industry-money’ mentality. I make my judgments about people, now as a full-time farmer, just as I did as a farm organization executive, and a university prof before that – based on the experience of the person, consistency with good science, and my judgment of personal integrity – but not based on who paid for what.

To be complete, there is one difference between public and private that I must mention: I do find a tendency for greater arrogance among those in public versus those in private employ. Some of the former can be quite annoying with their auras of self-importance. Fortunately, this tendency involves only a small minority.

But now back to Kevin Folta.

Folta is an outstanding individual and agriculture has benefitted so greatly from his communication skills and personal commitment. He did not need to voice a public word of support for genetic engineering of farm/food crops, but he has done so repeatedly at great personal cost – and I for one am most grateful.

We’ve also learned that he’s human.

I’ve watched a greater tendency for him of late to engage repeatedly and publicly with many critics – understandable but of questionable effectiveness or value. Folta might be advised to read Mark Lynas’ comments in Seeds of Science on how he handles the same. (Lynas mostly says nothing.) Or better, to heed Winston Churchill’s sage advice, “You will never get to the end of the journey if you stop to shy a stone at every dog that barks.”

Thanks Kevin.

Critique of: Impacts of soil carbon sequestration on life cycle greenhouse gas emissions in Midwestern USA beef finishing systems, (2018) by Dr. Paige L. Stanley et al, Michigan State University

Canadian Cattlemen beef photo

Credit: Canadian Cattlemen

A number of recent research reports/reviews have concluded that, contrary to popular opinion, intensive feed-lot systems for finishing beef cattle result in lower greenhouse gas emissions per kg of beef carcass weight than grazing (“grass-fed”) systems (an example here). However, a recent paper from a group at Michigan State University found that, when the soil carbon sequestration benefit is included with a well-managed grazing system, the balance is reversed. Because of the dramatic nature of this finding and a long-term personal interest in soil carbon sequestration, I have reviewed their paper. I conclude that their results are not realistic nor supported adequately by their research methodology.

Dr. Stanley et al describe research where beef pasture research fields in Michigan were converted from continuous grazing to managed-rotational grazing. After four years, they reported that the organic carbon (OM) content in the upper 30 cm of soil increased 40% from 34 to 48 tonnes/ha – or an average of 3.6 t/ha/year.

If it is assumed that soil organic matter is 58% carbon, this equates to an average OM addition of 6.2 t/ha/year. And if it’s assumed (generously, 2018 reference here) that about 25% of the organic matter (tops and roots), fixed by the forage crop during the four years after grazing, remains in the soil after the four years, this equates to about 25 t/ha/year of annual organic matter addition. Actual crop organic matter production must have been somewhat larger to account for the material removed and respired by grazing animals.

To put this in perspective, 25t/ha/year is about equivalent to the grain, stover, root and root exudates produced by a 190 bushel/acre corn crop, assuming grain represents 40% of total OM .

I don’t believe that this is credible.

So why the discrepancy? There is no suggestion that the authors fudged their data and no evidence for such, but here are some possible explanations.

Firstly, the authors give limited accounting of how the manure produced in the non-grazing season was used – the manure coming from hay apparently purchased from off-station and used to feed cows and over-wintering calves. The authors state that no commercial fertilizer was used in this research so manure supplied the fertility, especially for potassium for alfalfa.  Manure addition would have provided organic matter.

And secondly, the authors appear to have only one valid replicate comparison for the change in soil organic matter content. They do present data for three sample locations but only one comparison involves the same soil type measured both before and after (i.e., a “sandy loam” soil).

The paper has some other weaknesses which cause me concern. It contains limited statistical analysis and most of the calculations are based on data from elsewhere including Michigan averages and global numbers provided by the International Panel on Climate Change or other sources. But yet the authors present their results to three (sometimes four) significant figures, implying a high level of precision. One significant figure might be more appropriate.

In summarizing, this is not an attempt to attack the integrity of researchers or institution, or to understate the importance of the issue under consideration. However, I don’t believe that the results provide more than a hint that soil organic matter might be enhanced by well-managed grazing in a beef system; and this, in turn, could reduce the net greenhouse gas emissions in beef production.


What’s Your View on Mandatory Labelling of GM Foods? It depends so much on whether you have ‘Skin In The Game’

This column has two parts: The first discusses why the prospect of mandatory labelling of foods containing GM ingredients is viewed different if you are a farmer. The second is a critique of a research paper by Kolodinski and Lusk on public attitudes to short-term mandatory GM labelling in Vermont. Each is about 1200 words.

GLP Label GM Food

The on-going debate has heated again in North America about mandatory labelling of foods containing genetically modified/genetically engineered ingredients (also known as GM, GE and GMOs; the abbreviation GM will be used mostly in this column). That’s probably because of recent proposals made by the United States Department of Agriculture (USDA) on labelling options – a response to an earlier law mandating such passed by the American government on July 27, 2014.

The federal law was triggered by a similar law passed by the State of Vermont in 2014, becoming effective on July 1, 2016 – and a worry in Washington that other American states would also institute their own state-specific rules for mandatory labelling – effectively creating a nightmare for national food companies forced to comply with a potentially complex mess.

The federal law eliminated the right of states, including Vermont, to pass/implement their own labelling laws – but introduced a series of related debates on how to label, what to label, how to enforce  and more. The federal law gave USDA two years to develop the labelling specifics – and hence the proposals released recently.

That this is occurring at all is the result of a largely successful campaign by organizations opposed to genetically engineering in agriculture who have used a ‘right to know’ theme on labelling as an early step in attempting eliminate most/all genetically modified ingredients from the food system.

This is an approach which has worked very well for them in Europe where the combination of government requirements for mandatory labelling and anti-GM campaigning have essentially eliminated GM ingredients from foods in grocery stores. The one huge exception, of course, involves food products made from/by farm animals which are fed GM-based feeds; there is an inadequate supply of non-GM protein-rich feed available to European livestock farmers. And, despite the best efforts of anti-GM pressure groups, these products remain on grocery shelves – at least for now.

There is broad concern that what worked in Europe could also work in North America, meaning loss of the large benefits which GM have meant – both economic and environmental – for food and fibre production in the United States and Canada. Hence the strong opposition to mandatory labelling among many biotechnology companies, farmers and other biotech supporters in these countries.

While the strongest voices in support of mandatory GM labelling have come from anti-GM groups and commercial entities which will profit from GM-ingredient exclusions, support has also come from some individuals – commonly academics and journalists – generally known to be supportive of the use of GM technology in agriculture.

Their rationale is a belief that if/when mandatory GM labelling does occur, unlike in Europe, most North American consumers will adjust to this quickly; they will learn to ignore words on labels like ‘contains genetically engineered ingredients’ knowing that this has no significance to human health (the exception being ingredients deliberately engineered to improve health). Most of these proponents of mandatory labelling have been clear that their opinions are based not so much on solid research – for there is scarcely any – but rather intuitive feelings about human nature and experience with consumer whims.

To be fair on research, there is plenty of survey data. Jayson Lusk and his colleagues, former at Oklahoma State University, now at Purdue University, have done monthly surveys of consumer attitudes to many things including GM labelling. A late June 2018 survey report from the International Food Information Council Foundation (an industry-funded group) found 47% of Americans avoid foods known to be genetically engineered and, further, that “uncertainty about which foods are genetically modified is the primary reason for not avoiding [GE] foods.”

However, what consumers tell surveyors is often very different from what they do in practice. See, for example, this review by Alexander Stein of the EU Commission, “Acceptance of ‘GM food’ in Europe: What people say and do.”

Stein includes this graphic:

dhber4gw0aacb0a

Pro-mandatory-labelling advocates know this discrepancy well, and their position seems more instinctive. If I can generalize, it’s “Other approaches aren’t solving the problem – i.e., lack of broad consumer/support for GM products – so why not try mandatory labels? Let’s give it a shot.”

Very apparent, at least to me, is the fact that virtually none of those professionals advocating labelling actually grows farm crops – GM or not – to provide for family income. Few if any know the ‘joy’ of harvesting corn-borer-damaged, lodged corn or of filling insecticide boxes on planters – or of deciding which herbicide to use on weed escapes in a non-GM crop knowing that every choice is likely to work only partly, or cause crop damage, and will cost hundreds (more likely thousands) of dollars to apply. None of them have kids whose attendance at summer camps depends on protecting crop yields and quality from pest damage, and the cost of doing so.

If mandatory labelling means loss of markets for GM crops as ‘right to know’ proponents intend, the consequences for farmers will be far bigger than an “Oops, guess I was wrong.”

(Yes, I recognize that farmers growing GM-free ‘identity preserved’ crops receive premiums for their efforts, but that was not the case in pre-GM days, nor will it be again if the GM option is withdrawn.)

To use the vernacular, farmers have ‘skin in the game.’ Well-meaning academics and journalists don’t. In my view that makes a big difference.

As one of those farmers, I have no idea whether mandatory GE labelling will work or not. But in the absence of good clear evidence for the former, I need more than “let’s give it a shot.” I also support credible voices who say food labelling should be reserved for meaningful information on health and nutrition – and not the scare tactics of albeit-very-strong voices of the anti-GMO crowd.

Please note that this is not a blanket condemnation of top researchers and quality journalists – but rather a difference in viewpoint on one – albeit very significant – issue.

An additional reason for caution involves the key question of what, actually is a GM or genetically modified/engineered crop, animal or food (or ‘biologically engineered’ to use the USDA’s apparent wording preference)?

Nathanel Johnston addressed this well in his classic, It’s practically impossible to define ‘GMOs’ . Pro-biotech labelling proponents generally have something far less comprehensive in mind than many activists. And a quick check of postings on Twitter shows that the food industry is all over the map on what’s to be in and what’s not.

Anyone who thinks the noise will down once mandatory labelling is in place is naive in my view. It simply shifts from ‘whether’ to ‘what’ – not to mention the real reason for the activists’ campaign: elimination.

Another concern stems from a discussion by Mark Lynas in his great new book, Seeds of Science. He describes how, in earlier days of seeking public assurance of precautions being taken by biotech researchers, technicians allowed themselves to be photographed in attire resembling space suits. Casually dressed photographers a few feet away obligingly conveyed the message to the rest of the world: ‘GMOs must be dangerous if research workers need to dress like that.’

Lynas states, “It was a classic example of how precautionary regulations aimed at reassuring the public can have the opposite effect.”

Precautions inherent in the Cartagena Accord for introducing GM crops into the developing world have served – intentionally or inadvertently – to inform people in those countries that GM crops represent special danger – unlike all other methods for genetic improvement.

That brings me to a June 2018 paper by Kolodinski and Lusk, entitled Mandatory labels can improve attitudes toward genetically engineered food. It purports to show that the introduction of mandatory labelling of GM-containing foods in Vermont led to a “19% reduction in opposition to GE foods.” Given that this paper has received international attention and has been cited several times as proof that the labelling approach works to quell public concern, I’ve discussed it in some detail, below.

The research involved telephone survey opinions of Vermont residents on five dates between March 2014, about the time the Vermont legislation was passed, and March 2017, well after the date of enactment of the Vermont law in mid 2016 and it’s negation by a federal law four weeks later. Those surveyed were asked to give a 1 to 5 answer to the question, “Overall, do you strongly support, somewhat support, have no opinion, somewhat oppose, or strongly oppose the use of GMOs in the food supply?” The authors compare results from this survey to a US national on-line survey repeated on about the same dates with the question: “How concerned are you that the following pose a health hazard in the food that you eat in the next two weeks?” The authors attempt to equate the two surveys, using the differential between two-survey results on the five different dates to judge relative attitudes in Vermont compared to those nationally. But in truth, the comparison is very weak given the very different nature of the two questions and survey methods – and the authors do acknowledge that somewhat.

The authors use several different statistical models for analysis but all methods essentially divide the survey results into two time categories – three surveys completed before July 1, 2016 versus two after – with the assumption being that the existence of labelled food in grocery stores beginning July 2016 was the dominant factor in influencing/changing public attitudes.

This assumption, in turn, is based on a more basic assumption/statement that, to use their words, “there were no accompanying campaigns by pro- or anti-labeling groups designed to sway voter’s attitudes toward GE.”

But knowledge of the political system says this is highly unlikely. Almost every high-profile government law is implemented after lots of lobbying by interested groups and public campaigns – based on the knowledge that politicians mostly do what public pressure tells them to do. That would seem especially true for a highly charged issue like GM labelling. Remember that the legislative debate in Vermont followed high-profile public plebiscites on mandatory labelling in California and Washington State.

Indeed, a Google check tells us that the authors’ statement and assumption is clearly false. Take a minute to check this web site by a group called VT Right to Know GMOs listing many dozens of public events/rallies dating back to 2012. Even Vandana Shiva spoke to pro-labelling rallies in Vermont .

A related web site demonstrates the local and national media frenzy which existed in 2014 as the Vermont bill was being debated/approved.

An intriguing fact about the VT Right to Know web site is that all of its entries cease after August 4, 2016. Up until that date there are massive postings, one or more per week. After that date, total silence. It’s as if this activist group closed up shop and moved elsewhere – maybe back to the USRTK home base in Oakland, California.

When I tried a Google media search for the year 2017 with the words ‘Vermont’ and ‘GMO’ or ‘genetic engineering,’ I came up with almost nothing.

Of course, this fits a narrative that once mandatory labelling is in place, everything quietens down and the anti-GM folks are satisfied. A more likely explanation, at least to me, is that given the shift of national focus away from Vermont, why would any mainstream national NGO spent time in a tiny state with slightly over 600,000 residents (about 0.2% of the US)?

But is this really what we could expect on a larger national scale? Why would anti-GM folks stop with mandatory labels when their stated goal is much larger?

I don’t live in Vermont but my guess is that there was huge public attention peaking in 2014 and that it was maintained as the state and nation watched to see if court challenges by major biotech companies on the legitimacy of the Vermont law were successful. (They weren’t but this process continued until September 2016.) After that, as noted above, all GM-related attention left Vermont.

A final question is the extent to which food products were actually labelled during that window between July 1 2016, when the Vermont law came into force, and July 27, when negated by US statute. Kolodinsky and Lusk are vague on that matter.

Not finding much on the web, I contacted my friend Dr. Mary Mangan (@mem_somerville) in Boston and she provided this report. (Thanks also to Biofortified.org .) While totally anecdotal it does describe the 3-6 month phase-in which Vermont grocery retailers had after July 1, 2016 for compliance. Vermont shoppers were obviously exposed to some GM food labelling but we may never know how much.

And that brings us back to the Kolodinsky and Lusk data. They show these average survey ratings in Vermont for the five dates, with a ‘5’ meaning strongly oppose GMOs, a ‘1’ meaning strongly support and a ‘3’ meaning neutral.

Survey date
March 2014 March 2015 March 2016 Nov 2016 March 2017
Average rating 3.714 3.775 4.012 3.474 3.715
Standard deviation 1.007 1.0337 1.183 1.367 1.159


The most intriguing result for me – i.e., beyond the statistical reality that all survey numbers are the same – is that the level of concern at the beginning and end of the three-year survey period was identical, 3.71.

Personally, I might have expected greater concern in March 2014 given that this coincided with the legislative vote, local media hype, and related VT Right to Know efforts.  It may have taken some time for the sustained frenzy to trigger greater public concern; hence, higher values in 2015 and early 2016. The drop in Nov 2016 might have represented a local view that the ‘problem is solved’ and the fact that USRTK had left the state. But why is there such a rebound in public concern from Nov 2016 to March 2017? That rebound is ignored in the authors’ discussion.

(At the risk of adding complexity, I note the authors make much of differences in average scores between the Vermont and national surveys on the five dates. While, personally skeptical about the validity of this, I do note in their data that the national average score descended from 3.360 in Nov 2016 to 3.188 in March 2017, even as the Vermont score rose. Whatever happened in Vermont was probably local.)

So what do we learn from this paper about the experience in Vermont. My impression is not very much. And this is before considering that the definition of GM used in the Vermont legislation was tailored to provide key exemptions to accommodate special state interests, notably dairying – a taste of what lies ahead as special interests lobby in Washington to have their interests addressed in whatever emerges as the national standard.

I suppose the study served a useful purpose for those looking for support for their prior opinion that mandatory labelling is the way to go. For farmers with major concerns about the risks to personal income and family wellbeing, the doubts remain as big as ever.